ISSN: 1204-5357
ISSN: 1204-5357
NAVEED RAZA
PhD Scholar, University Malaysia Terengganu, School of Maritime Business and Management, 21030, Kuala Terengganu, Kuala Terengganu 21030, Malaysia
SAJID ALI
PhD, University Malaysia Terengganu, T145, 21300 Kuala Terengganu, Terengganu, Malaysia
AZWADI ALI
PhD, University Malaysia Terengganu, T145, 21300 Kuala Terengganu, Terengganu, Malaysia
NURASYIKIN BT JAMALUDIN
PhD, University Malaysia Terengganu, T145, 21300 Kuala Terengganu, Terengganu, Malaysia
Visit for more related articles at Journal of Internet Banking and Commerce
This paper examines Pakistani Banks stock return and volatility relationship with market, interest rate and foreign exchange rate. The study extensively applies different statistical approaches to model return and volatility relation. First, Ordinary Least Square (OLS) multiple regression model is applied for estimation of return relation. Further, Generalize Method of Movement (GMM) is applied to cater the endogeniety issue. Secondly, Due to presence of Conditional Heteroskedasticity, Weighted Least Square (WLS) and Generalize Auto Regression Conditional Heteroskedasticity - GARCH (1,1) estimation model is applied to estimate conditional return and volatility. Interest rate and foreign exchange rate have significant impact on unconditional and conditional bank stock returns under different model specifications. Market return is a determining factor in bank stock pricing. The results infer that bank volatility is significantly related with interest rate and foreign exchange rate risk. The volatility of bank stock returns is persistent with slower decay over time.
Bank Stock Returns; Volatility; Interest Rate; Foreign Exchange Rate; GARCH; Pakistan
The change in interest rate and foreign exchange rate is believed to have impact on bank’s stock return and volatility. Bank stock returns can either be directly affected due to lack of asset liability management or due to indirect impact on profitability and expected cash flows [1]. The impact is largely determined by the state of economy or risk management skills and practices of bank managers. These attributes are different in developed and developing countries. In developing countries, lack of risk management practices coupled with financial liberalization process shapes the relationship between interest rate, foreign exchange rate and bank stock risk and return patterns. However, the role of banks differs somewhat by country, but they always are the key players channeling money for business investments [2]. Volatility in interest rates and exchange rates has a deleterious effect on banks’ performance. This decline in performance is usually witnessed by events like mismanagement of risks and the resulting decline in future profitability and cash flows of the banking sector. As financial systems are liberalized, unexpected fluctuations in interest rates and exchange rates become more common and the performance of banks suffers greatly if risk management mechanisms are not around to hedge these risks [3,4]. Historically, banking sectors in developed economies have done a great job in utilizing advanced risk management mechanisms in periods of high volatility. But developing economies have usually lacked the financial infrastructure to implement these techniques historically and they still do. But with the global implementation of BASEL framework, banks have now become more resilient to certain types of risks [5].
Financial liberalization is a characteristic feature of financial systems in the developing economies and has partly been held responsible for increasing volatility in interest rates and exchange rates historically since it lifts the regulatory barriers and allows these variables to move freely which contributes to increasing volatility [6]. Consequently, banks’ stock returns suffer as the value gets eroded off their stock prices. This relationship among stock returns, interest rate, and exchange rate has been explained in major theories including International Capital Asset Pricing Model (ICAPM), Arbitrage Pricing Theory (APT), and Nominal Contracting Hypothesis1.
The banks play a major role to facilitate the businesses as a financial intermediary in Pakistan, hence leading to growing investment and economic prosperity. The financial liberalization process initiated in Pakistan (in the early 1990s) with a view to stabilize the macroeconomic situation improved the efficiency of the banking sector [7]. This process was marked with significant changes in the regulatory supervision concerning exchange rates and interest rates and can be considered as having two pronged implications for Pakistan’s economy. First is the risk management perspective according to which liberalization entailed increasing volatility in interest rates and exchange rates. However, owing to the recent development of Pakistan Mercantile Exchange and the implementation of BASEL framework, banks have started performing better risk management comparatively as was the case a decade ago. Pakistan’s banking sector reforms which were initiated in the early 1990s have transformed the sector into an efficient banking system which was later endorsed during a joint session of IMF and the World Bank with the objective to carry out a comprehensive assessment regarding the impact of reforms. Banks (of which private banks hold 80% of the total banking sector assets) in Pakistan have evolved over time from institutions that once lacked risk management mechanisms to hedge against risks such as interest rate and exchange rate risk to more well managed and resilient institutions. Second is the investors’ perspective. They demand higher premium in the face of high volatility ensuing from interest rate and exchange rate fluctuations. These fluctuations exert an immense pressure on the common stocks of financial institutions including banks through wealth distributions effects caused by unexpected inflation [8,9].
Following the work of Kasman et al. [1] and appreciating the role that interest rate and exchange rate volatility has played in affecting the stock returns of banks, this study attempts to investigate the joint impact of interest rate and exchange rate volatility on banks’ stock returns in Pakistan’s context since it will greatly help the policy makers in assessing the aftermath of liberalization-led volatility in the banking sector of Pakistan (as no study has been conducted in the South Asian context) and will also help them in formulating and adopting more resilient risk management policies and practices in future. This study also develops some interesting insights for other South Asian economies which liberalized their financial systems. These insights will foster future empirical endeavors in the region. Rest of the paper has been organized as follows: Section 2 highlights major studies which have been conducted in this strand of literature and also highlights the research gap. Section 3 presents data characteristics and section 4 is research methodology for the present study. Section 5 presents and discusses estimation results. Section 6 discusses policy implication based on estimation results and concludes the paper.
The stock returns’ sensitivity to interest rate and exchange rate fluctuations has been well researched in the past. Researchers have been resorting to different estimation techniques for improving the reliability and applicability of their results. Obviously, these studies have entailed different findings owing to the variations in data sets and estimation techniques as indicated by Kasman et al. [1] in their study. Flannery [10] studied the individual impact of interest rate fluctuations on US bank stocks by using cash flow approach and found that they did not explain variations in stock returns significantly. Similarly, some other studies also examined the individual impacts of interest rates and exchange rates on stock returns and volatility by using different estimation techniques.
Harris et al. [11] investigated the correlation between exchange rates and stock returns of a portfolio of 28 commercial banks for the period from 1977 to 1986 using error components model. They used GLS and OLS estimation techniques in their study and found that the relationship between these two variables not only varied over time but also across different banks since different banks had different attitudes towards risk management and also pursued foreign operations differently.
Yourougou [12] examined the impact of interest rate risk on the pricing of common stocks of financial institutions and industrial firms on the backdrop of the argument set forth in previous studies [13-15] that the common stocks of banks are comparatively more sensitive to fluctuations in nominal interest rates as compared to those of industrial firms. He examined the interest rate sensitivity in two sample periods, i.e. pre-October 1979 when the interest rates were relatively stable and post-October 1979 when interest rates were highly volatile by using a two factor model and ARIMA techniques. The estimation for two factor and ARIMA models was carried out using OLS and maximum likelihood estimation techniques respectively. Based on likelihood estimates, he concluded that interest rate risk is priced in capital markets and his results also supported those presented earlier by Sweeney et al. [14] who used different sample and estimation techniques. Though, as persuasive and tempting the results may seem, it is quite implicitly evident in the previous discussion that these studies were subject to econometric limitations since they did not consider the time-varying nature of stock returns’ sensitivities and used linear estimation techniques for studying the relationship; the fact which has also been indicated recently by Kasman et al. [1] in their study.
Only a few studies have been found which investigated the joint impact of interest rates and exchange rates recently with the help of modern estimation techniques. Kasman, et al. [1] examined the joint impact of interest rate and exchange rate fluctuations on Turkish banks' stock returns by applying the OLS and GARCH estimation techniques. Their results indicate that interest rate and exchange rate changes have a negative and significant effect on the contingent bank stock returns. Chkili et al. [16] used univariate and multivariate GARCH models to study the relationship between stock return volatility and exchange rates by using daily closing prices of stock market indices for three European countries, including CAC40 index (France), the DAX index (Germany) and the FTSE100 index (United Kingdom) and found bilateral relationships between stock and exchange markets. Walid et al. [17] studied the relationship between stock price volatility and exchange rate changes by utilizing a Markov-Switching EGARCH model for four developing countries including Hong Kong, Singapore, Malaysia and Mexico over the period 1994–2009. They recognized differences in both the conditional mean and the conditional variance of stock returns across two diverse administrations (i.e. Asia and Latin America). They also concluded that the relationship between stock volatility and exchange rate is regime dependent.
In the context of aforementioned studies, some research gaps have been identified. Firstly, very few studies have investigated a joint impact of market, interest rate, and exchange rate volatility on bank stock returns and volatility. Secondly, the stock returns’ sensitivity to market, interest rate, and exchange rate fluctuations has been assumed to be time-invariant which is implicit in the use of linear estimation techniques in previous studies. Thirdly, most of the studies have been conducted in the context of developed economies where the profession of risk management is now at a very advanced stage while no studies have been conducted in the context of less developed (especially South Asian) economies which were liberalized in later years as compared to the developed economies and have been prone to greater volatility in interest rates and exchange rates with no advanced mechanisms for hedging these risks.
Considering the above mentioned research gaps, present study attempts to investigate a joint impact of market, interest rate, and exchange rate fluctuations on bank stock returns and volatility in Pakistan while appreciating the time-varying nature of stock returns’ sensitivities. Considering the financial liberalization process, lack of presence of risk hedging instruments, depreciating currency value and less developed financial markets, the need to investigate the stock returns’ sensitivities to market, interest rate, and exchange rate fluctuations sounds fairly pressing and justified in the case of Pakistan. This is one of the first studies to appreciate the importance of this strand of literature in the South Asian context.
Data
The study sample consists of daily stock price data of ten banks (Table 1) listed on the Karachi Stock Exchange (KSE) along with daily values of interest rates and exchange rates for the period from January 1, 2005 to December 31, 2015. An equally weighted index is also constructed using the sample banks. Banks stock prices are obtained from the official website of KSE. The foreign exchange (FX) rate is based on US dollar, and the interest rate is measured as that on the 90 days Treasury Bill (TB) issued by the Government of Pakistan (GoP). The KSE-100 index is used as proxy for the market index. The continuously compounded returns for the data are computed as rt=Ln(Pt/Pt-1), where Pt is the stock price at time t, and Pt-1 is the stock price at time t-1.
Table 1: Sample banks and period.
| Sample | Period | ||
|---|---|---|---|
| Symbol | Bank | From | To |
| BAFL | Bank Al-Falah XD | 31.12.2005 | 31.12.2015 |
| BAHL | Bank AL-HabibXD | 31.12.2005 | 31.12.2015 |
| BOP | B.O.Punjab | 31.12.2005 | 31.12.2015 |
| FABL | Faysal Bank | 31.12.2005 | 31.12.2015 |
| KASBB | KASB Bank Ltd. | 31.12.2005 | 31.12.2015 |
| MCB | MCB Bank Ltd. XDXB | 31.12.2005 | 31.12.2015 |
| MEBL | Meezan Bank Ltd.XB | 31.12.2005 | 31.12.2015 |
| NBP | National Bank.XDXB | 31.12.2005 | 31.12.2015 |
| NIB | NIB Bank Limited | 31.12.2005 | 31.12.2015 |
| SNBL | Soneri Bank Ltd | 31.12.2005 | 31.12.2015 |
| INDEX | Equally Weighted Index | 31.12.2005 | 31.12.2015 |
Descriptive statistics (Table 2) are of individual bank returns, market index, interest rate and foreign exchange rate. Average return is negative for all stocks except those of MCB and MEBL. The return distribution is negatively skewed for all data except KASBB. The higher values of kurtosis statistic indicate deviation from normality where distributions are leptokurtic, more data clustered around mean or fat-tailed. Normality of return distributions is rejected at 1% level, measured through Jarque-Bera (JB) statistic. Unit root is verified by Augmented Dickey Fuller (ADF) test, all data is stationary at 1% except interest rate which is significant at 5% level. To address the issue of multicollinearity, correlations among exogenous variables are calculated. Variables have correlation coefficients between -0.0064 to -0.0497. Multicollinearity can be a significant problem if the pair-wise correlation among any two independent variables ranges between 0.637 and 0.771. The correlation coefficients in this study indicate that multicollinearity is not a serious problem in this study.
Table 2: Descriptive statistics.
| Mean | SD | Skewness | Kurtosis | Jarque-Bera | ADF | |
|---|---|---|---|---|---|---|
| BAFL | -0.0004 | 0.0337 | -7.9027 | 194.4 | 2866244* | -41.637 |
| BAHL | -0.0002 | 0.0264 | -5.7943 | 70.17 | 360872* | -41.950 |
| BOP | -0.0010 | 0.0345 | -0.7485 | 11.98 | 6448.64* | -39.419 |
| FABL | -0.0008 | 0.0324 | -8.0519 | 197.2 | 2949299* | -40.715 |
| KASBB | -0.0009 | 0.0397 | 0.1538 | 7.540 | 1608.42* | -46.730 |
| MCB | 0.0007 | 0.0269 | -0.4149 | 8.512 | 2413.15* | -40.362 |
| MEBL | 0.0004 | 0.0258 | -0.6742 | 11.26 | 5350.71* | -40.519 |
| NBP | -0.0003 | 0.0284 | -1.7166 | 18.06 | 18530.4* | -26.115 |
| NIB | -0.0012 | 0.0448 | -5.0631 | 137.9 | 1421816* | -42.902 |
| SNBL | -0.0009 | 0.0323 | -1.6131 | 21.47 | 27305.2* | -41.552 |
| INDEX | -0.0005 | 0.0183 | -0.4824 | 7.0136 | 1323.40* | -38.169 |
| MRK | 0.0005 | 0.0147 | -0.3372 | 5.312 | 450.64* | -36.447 |
| INT | 0.1045 | 0.0233 | -0.5302 | 2.537 | 103.93* | -2.932 |
| FX | -0.0003 | 0.0065 | -0.3196 | 20.09 | 22741.8* | -34.191 |
Note: SD denotes standard deviation. MRK, INT and FX present market index return, interest rate and foreign exchange rate, respectively. *Significance at 1%
Following model has been estimated using OLS:
 (1)
(1)
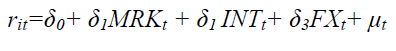
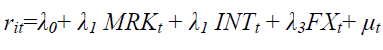
Where rit is the return of the ith stock at time t; MRKt denotes return on the market index; INTt is the return on a 90 days treasury bill return; and FXt is the return on the foreign exchange rate (FX). β0 is the intercept termand μt, is an error term with the assumption of an iid condition. In order to identify the inherent flaws in OLS estimation, Durbin–Wu–Hausman test is applied to examine endogeneity. Due to presence of endogeneity, Generalized Method of Movement (GMM) with lagged values of the variables as instruments is used for estimation (Equation 2).
 (2)
(2)
Next, the ARCH (1), Breusch Pagan Godfrey (BPG), White (with white cross term) tests have been used to ascertain whether OLS estimation is appropriate for the given data set or not. Weighted Least Square (WLS) estimation (Equation 3) is used to cater the issue of heteroskedasticity.
 (3)
(3)
The GARCH (1,1) by Bollerslev [18] as per following specification2 is also estimated:
 (4)
(4)
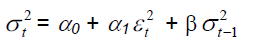
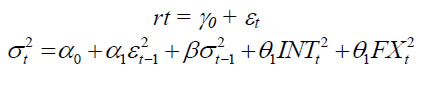
The GARCH (1,1) process in Equation (4) presents both mean and variance equations. Mean equation parameters have same definition as explained in Equation (1). In variance equation, α0 presents average long term volatility. α1 and β present last period’s squared return (ARCH term) and forecast variance (GARCH term) respectively. In conditional variance equation, all the parameters must satisfy the α0>0, α1>0, β>0 and α1 + β ≤ 1 conditions for stability to hold. For the assessment of volatility relation between interest rate, exchange rate and bank stocks, following GARCH (1,1) model is used. 2 t INT and 2 t FX are used to measure the interest rate and FX rate return volatility (Figure 1).

Figure 1: Residual plot – KASBB.
 (5)
(5)
Estimation Using OLS, GMM and WLS
Market return was found to possess greater explanatory power than either of interest rate (significant in only one case) and foreign exchange rate (insignificant in all cases) and it was found to have a significant positive impact on stock returns of all banks in the sample (Table 3). The coefficient of interest rate return is significant and negative only for MCB bank which implies that MCB stock returns are affected by interest rate movement. Last three columns of Table 3 further reveal that heteroskedasticity is present in OLS estimation process of banks which makes the OLS estimates unreliable. Volatility clustering, a necessary condition to apply ARCH series models, is also verified through scatter plot of OLS regression error terms.
Table 3: OLS estimates of individual banks and Index.
| β0 | β1 | β2 | β2 | Adj. R2 | LM Test | DW State | ARCH (1) | BPG Test | White Test | |
|---|---|---|---|---|---|---|---|---|---|---|
| BAFL | 0.0004 | 0.9588* | -0.0128 | 0.1391 | 0.1759 | 4.3564 | 1.9307 | 0.002 | 16.92* | 91.67* |
| (0.0033) | (0.0481) | (0.0304) | (0.1083) | |||||||
| BAHL | -0.0016 | 0.6896* | 0.0095 | 0.0525 | 0.1467 | 1.7014 | 1.9823 | 0.024 | 4.201 | 19.17** |
| (0.0026) | (0.0384) | (0.0243) | (0.0864) | |||||||
| BOP | 0.0004 | 1.2164* | -0.0198 | -0.1675 | 0.2717 | 6.008** | 1.8798 | 6.385** | 3.324 | 4.857 |
| (0.0031) | (0.0463) | (0.0293) | (0.1042) | |||||||
| FABL | 0.0002 | 0.8681* | -0.0138 | -0.0067 | 0.1551 | 6.274** | 1.8944 | 0.0058 | 1.301 | 2.237 |
| (0.0032) | (0.0469) | (0.0296) | (0.1056) | |||||||
| KASBB | 0.0038 | 0.4334* | -0.0477 | 0.0132 | 0.0255 | 15.446* | 2.17628 | 138.34* | 43.81* | 64.68* |
| (0.0042) | (0.0617) | (0.0390) | (0.1390) | |||||||
| MCB | 0.0037*** | 1.1611* | -0.0348*** | 0.0705 | 0.4060 | 4.2422 | 1.9727 | 83.757* | 25.17* | 170.05* |
| (0.0022) | (0.0327) | (0.0206) | (0.0735) | |||||||
| MEBL | 0.0000 | 0.6101* | 0.0000 | -0.1033 | 0.1278 | 1.8544 | 1.9511 | 17.590* | 0.7455 | 25.855* |
| (0.0025) | (0.0376) | (0.0238) | (0.0848) | |||||||
| NBP | 0.0026 | 1.2271* | -0.0336 | -0.0302 | 0.4071 | 2.6532 | 1.9733 | 0.268 | 7.37*** | 10.602* |
| (0.0023) | (0.0344) | (0.0218) | (0.0775) | |||||||
| NIB | -0.0012 | 1.2115* | -0.0068 | -0.0879 | 0.1581 | 11.155* | 2.0448 | 0.268 | 0.3710 | 2.384 |
| (0.0044) | (0.0647) | (0.0409) | (0.1456) | |||||||
| SNBL | -0.0013 | 0.8498* | -0.0008 | -0.1425 | 0.1503 | 0.5864 | 1.9724 | 5.745** | 3.4417 | 28.19* |
| (0.0032) | (0.0468) | (0.0296) | (0.1054) | |||||||
| INDEX | 0.0007 | 0.9226* | -0.0160 | -0.0262 | 0.5519 | 13.659* | 1.8763 | 24.14* | 12.78** | 68.14* |
| (0.0013) | (0.0193) | (0.0122) | (0.0434) | |||||||
| No. of significant cases | 1/11 | 11/11 | 1/11 | 0/11 | 4/11 | 6/11 | 5/11 | 8/11 |
Note: Numbers in parenthesis indicate the standard errors. *, **, *** Indicates the significance level at 1%, 5% and 10%, respectively.
The results of GMM estimation are presented in Table 4. The relationship between market return and bank stock return is same as found with OLS; however, foreign exchange rate is negative and significant in 3 out of 11 cases. Interest rate is negative and significant in 2 out 11 cases.
Table 4: GMM estimates of individual banks and Index.
| δ0 | δ1 | δ2 | δ3 | Adj. R2 | |
|---|---|---|---|---|---|
| BAFL | -0.0035 | 1.0051* | 0.0277 | -0.4769*** | 0.1604 |
| (0.0031) | (0.2840) | (0.0285) | (0.2605) | ||
| BAHL | -0.0027 | 0.6562** | 0.0236 | 0.4059** | 0.1393 |
| (0.0035) | (0.2672) | (0.0308) | (0.2002) | ||
| BOP | 0.0003 | 1.2257* | -0.0212 | -0.4654*** | 0.2692 |
| (0.0030) | (0.2424) | (0.0293) | (0.2781) | ||
| FABL | 0.0032 | 0.5251*** | -0.0393 | -0.5242** | 0.1205 |
| (0.0034) | (0.2831) | (0.0327) | (0.2324) | ||
| KASBB | 0.0040 | 0.7487** | -0.0488 | 0.4414 | 0.0102 |
| (0.0036) | (0.3676) | (0.0366) | (0.4257) | ||
| MCB | 0.0041 | 1.0267* | -0.0370 | 0.6326*** | 0.3821 |
| (0.0033) | (0.2419) | (0.0301) | (0.3739) | ||
| MEBL | -0.0007 | 0.7286* | 0.0047 | -0.4127** | 0.1127 |
| (0.0031) | (0.2524) | (0.0287) | (0.2070) | ||
| NBP | 0.0011 | 1.5184** | -0.0185*** | -0.2910 | 0.3806 |
| (0.0025) | (0.1913) | (0.0235) | (0.2028) | ||
| NIB | 0.0036 | 1.0142** | -0.0530*** | -0.2764 | 0.1530 |
| (0.0033) | (0.4232) | (0.0310) | (0.4195) | ||
| SNBL | -0.0017 | 1.0126* | 0.0028 | -0.2211 | 0.1445 |
| (0.0033) | (0.3181) | (0.0307) | (0.3109) | ||
| INDEX | 0.0004 | 0.8932* | -0.0131 | -0.0673 | 0.5513 |
| (0.0018) | (0.1261) | (0.0160) | (0.1291) | ||
| No. of significant cases | 0/11 | 11/11 | 2/11 | 6/11 |
Note: *, **, *** Indicates the significance level at 1%, 5% and 10%, respectively.
WLS results (Table 5) again indicate strong positive relationship between market and bank stock returns. Coefficients of Interest rate are significant in 5 out of 11 cases. Whereas foreign exchange rate coefficients are significant in 8 cases. The impact of interest rate on bank stock return is mixed. It has a positive relation for BAHL, FABL and MEBL. There is no significant relation between index return and interest rate. Foreign exchange rate is negative and significant in 7 out of 11 cases including the index.
Table 5: WLS estimates of individual banks and Index.
| λ0 | λ1 | λ2 | λ3 | Adj. R2 | |
|---|---|---|---|---|---|
| BAFL | -0.0036 | 1.0085* | 0.0272 | 0.5456* | 0.3138 |
| (0.0043) | (0.0345) | (0.0415) | (0.1664) | ||
| BAHL | -0.0167* | 0.8113* | 0.1485* | -0.1207 | 0.3851 |
| (0.0030) | (0.0240) | (0.0289) | (0.1158) | ||
| BOP | 0.0021 | 1.2071* | -0.0516** | -0.3254* | 0.6367 |
| (0.0026) | (0.0214) | (0.0257) | (0.1030) | ||
| FABL | -0.0114* | 0.8745* | 0.1105* | -0.4969* | 0.5239 |
| (0.0024) | (0.0197) | (0.0237) | (0.0950) | ||
| KASBB MCB | 0.0078 | 0.3417* | -0.1261* | -0.0790 | 0.0730 |
| (0.0037) | (0.0297) | (0.0357) | (0.1434) | ||
| 0.0019 | 1.1446* | -0.0124 | 0.5826* | 0.6284 | |
| (0.0025) | (0.0204) | (0.0245) | (0.0984) | ||
| MEBL | -0.0099* | 0.5586* | 0.0679* | -0.1021 | 0.2693 |
| (0.0026) | (0.0215) | (0.0258) | (0.1035) | ||
| NBP | -0.0020 | 1.1920* | -0.0097 | -0.2143* | 0.7248 |
| (0.0021) | (0.0171) | (0.0206) | (0.0826) | ||
| NIB | 0.0070 | 1.3056* | -0.0703 | -0.5799* | 0.4171 |
| (0.0045) | (0.0363) | (0.0437) | (0.1752) | ||
| SNBL | -0.0097* | 0.8385* | 0.0416 | -0.4389* | 0.3308 |
| (0.0035) | (0.0281) | (0.0337) | (0.1353) | ||
| INDEX | -0.0035* | 0.9283* | 0.0126 | -0.1229* | 0.7986 |
| (0.0013) | (0.0109) | (0.0130) | (0.0524) | ||
| No. of significant cases | 5/11 | 11/11 | 5/11 | 8/11 |
Note: Numbers in parenthesis indicate the standard errors. *,**,*** Indicates the significance level at 1%, 5% and 10%, respectively.
Estimation Using GARCH Framework
Table 6 presents the GARCH (1,1) estimation results. Results indicate that market return has a significant positive effect on the stock returns of all banks in the sample. The results further indicate that conditional return has a significant negative relationship with exchange rate risk in only one case where the model parameters are stable. This significantly negative relationship with the exchange rate in case of FABL can be explained as the exchange rate fluctuations usually turn out to be deteriorating for a bank if it has greater volume of foreign currency denominated liabilities and the local currency depreciates in value.
Table 6: GARCH (1,1) estimation of returns.
| γ0 | γ1 | γ2 | γ3 | α0 | α1 | β | |
|---|---|---|---|---|---|---|---|
| BAFL | -0.0016 | 1.0911* | 0.0003 | -0.1118** | 0.0001* | 0.3332* | 0.6028* |
| (0.0017) | (0.0265) | (0.0158) | (0.0537) | (0.0000) | (0.0655) | (0.0468) | |
| BAHL | -0.0010 | 0.5273* | 0.0029 | 0.0200 | 0.0001* | 0.9826* | 0.3623* |
| (0.0011) | (0.0162) | (0.0101) | (0.0335) | (0.0000) | (0.2695) | (0.0483) | |
| BOP | 0.0043* | 1.1791* | -0.0591* | -0.0407 | 0.0001* | 0.5897* | 0.6161* |
| (0.0016) | (0.0267) | (0.0157) | (0.0528) | (0.0000) | (0.1416) | (0.0362) | |
| FABL | -0.0019 | 0.8711* | 0.0011 | -0.0299 | 0.0001* | 0.4131* | 0.5703* |
| (0.0016) | (0.0241) | (0.0156) | (0.0552) | (0.0000) | (0.0895) | (0.0409) | |
| KASBB | -0.0021*** | 0.2613* | 0.0157*** | 0.0084** | 0.0000* | 0.4138* | 0.7901* |
| (0.0012) | (0.0274) | (0.0086) | (0.0067) | (0.0000) | (0.0850) | (0.0133) | |
| MCB | 0.0025*** | 1.2421* | -0.0262*** | 0.0280 | 0.0000* | 0.3898* | 0.6662* |
| (0.0015) | (0.0226) | (0.0135) | (0.0462) | (0.0000) | (0.0683) | (0.0331) | |
| MEBL | -0.0015 | 0.5859* | 0.0109 | -0.0665 | 0.0001* | 0.3044* | 0.6151* |
| (0.0018) | (0.0259) | (0.0173) | (0.0651) | (0.0000) | (0.0472) | (0.0457) | |
| NBP | 0.0013 | 1.2538* | -0.0217*** | -0.0286 | 0.0001* | 0.7007* | 0.4393* |
| (0.0012) | (0.0189) | (0.0113) | (0.0417) | (0.0000) | (0.1546) | (0.0443) | |
| NIB | -0.0086* | 1.1143* | 0.0435** | -0.0203 | 0.0001* | 0.3026* | 0.6811* |
| (0.0024) | (0.0368) | (0.0220) | (0.0794) | (0.0000) | (0.0538) | (0.0359) | |
| SNBL | -0.0024 | 0.8045* | 0.0033 | -0.0542 | 0.0001* | 0.4503* | 0.6113* |
| (0.0018) | (0.0272) | (0.0172) | (0.0654) | (0.0000) | (0.0952) | (0.0421) | |
| INDEX | 0.0021** (0.0009) |
0.9438* (0.0139) |
-0.0275* (0.0089) |
-0.03612 (0.0311) |
0.0000* (0.0000) |
0.1071* (0.0196) |
0.8583* (0.0212) |
| No. of significant cases | 5/11 | 11/11 | 6/11 | 2/10 | 11/11 | 11/11 | 11/11 |
Note: Numbers in parenthesis indicate the standard errors. *, **, *** Indicates the significance level at 1%, 5% and 10%, respectively.
The direction and magnitude of foreign exchange rate impact depends on the assets and liability size which are denominated in foreign currency. The relationship has been found significant positive in case of interest rate risk in one case with stable parameters. Market return coefficient is positive significant in all cases. Results indicate that bank stock returns are largely impacted by the overall market which is captured by the market index in this study. And market return has high explaining power of bank’s conditional returns.
The intercept term (α0), in a conditional variance equation (Equation 2), significant and positive with approximate values of zero for all estimations. Both the ARCH estimates (α1) and the GARCH estimates (β) are positive and significant in all cases; however, the higher values of GARCH term than ARCH term are noted. This higher magnitude of GRACH estimates indicate that volatility of bank stock returns have larger impact of its long term variance as compared to its last period variance (surprises). In other words, effect of long term variance is persistent in volatility forecast process. The sum of α1 and β estimates are less than unity for 5 cases which indicate that overall volatility in bank stock returns is persistent and decreases at low rate. In short, market return has been found to play a key role in explaining conditional returns.
Estimation of Volatility Using GARCH Framework
The positive and statistically significant ARCH term (α1) and GARCH term (α) estimates with relatively higher values of GARCH estimates indicate higher impact of longer term volatility than last period shocks (Table 7)3. The sum of ARCH and GARCH estimates has decreased as compared to Equation 4 estimates when interest rate and currency exchange rate volatilities are introduced in variance equation (Equation 5). More persistence of volatility with slower decrease over time is evident in results. The impact of interest rate volatility, as estimated by coefficient θ1, is statistically significant with negative coefficient values in all cases. This finding suggests that when interest rates are volatile, the volatility in banks’ stock returns decreases.
Table 7: GARCH (1,1) volatility estimates.
| γ | α0 | α1 | b | θ1 | θ2 | |
|---|---|---|---|---|---|---|
| BAFL | 0.0000 | 0.0006* | 0.1075* | 0.2690* | -0.0162* | -0.1225* |
| (0.0006) | (0.0001) | (0.0239) | (0.0976) | (0.0034) | (0.0084) | |
| BAHL | 0.0001 | 0.0001* | 0.2791* | 0.4469* | -0.0025* | -0.0222* |
| (0.0003) | (0.0000) | (0.0307) | (0.0335) | (0.0006) | (0.0016) | |
| BOP | -0.0004 | 0.0005* | 0.3938* | 0.3535* | -0.0127* | -0.1034* |
| (0.0007) | (0.0001) | (0.0442) | (0.0355) | (0.0029) | (0.0070) | |
| FABL | -0.0004** | 0.0003* | 0.3212* | 0.5054* | -0.0142* | 0.0611** |
| (0.0002) | (0.0000) | (0.0373) | (0.0286) | (0.0015) | (0.0303) | |
| KASBB | -0.0004 | 0.0001* | 0.6296* | 0.7317* | -0.0029* | -0.0422*** |
| (0.0005) | (0.0000) | (0.1854) | (0.0233) | (0.0007) | (0.0242) | |
| MCB | 0.0000 | 0.0002* | 0.4605* | 0.5387* | -0.0104* | -0.0029 |
| (0.0004) | (0.0000) | (0.0519) | (0.0221) | (0.0000) | (0.0064) | |
| MEBL | 0.0003 | 0.0004* | 0.1369* | 0.4759* | -0.0155* | -0.0814* |
| (0.0006) | (0.0001) | (0.0228) | (0.0705) | (0.0029) | (0.0052) | |
| NBP | 0.0005 | 0.0003* | 0.4779* | 0.3545* | -0.0143* | -0.0361* |
| (0.0004) | (0.0000) | (0.0534) | (0.0388) | (0.0020) | (0.0072) | |
| NIB | -0.0009*** | 0.0001* | 0.2994* | 0.7674* | -0.0069* | -0.0363* |
| (0.0005) | (0.0000) | (0.0440) | (0.0176) | (0.0001) | (0.0067) | |
| SNBL | -0.0008*** | 0.0001* | 0.2225* | 0.6693* | -0.0023** | -0.0470* |
| (0.0005) | (0.0000) | (0.0286) | (0.0320) | (0.0011) | (0.0167) | |
| INDEX | -0.0002 (0.0004) |
0.0002* (0.0000) |
0.1622* (0.0258) |
0.4813* (0.0596) |
-0.0077* (0.0012) |
-0.0392* (0.0027) |
| No. of significant cases | 3/10 | 11/11 | 11/11 | 11/11 | 11/11 | 10/11 |
Note: Numbers in parenthesis indicate the standard errors. *, **, *** Indicates the significance level at 1%, 5% and 10%, respectively.
A possible explanation for this surprisingly interesting finding lies in the fact that banks are able resort to financial derivatives to hedge against short term interest rate risk and are specialists in asset/liability management which should not appear uncommon in the case of Pakistan given the banking reforms which were introduced in 2004 and the availability of derivative instruments owing to the development of the Pakistan Mercantile Exchange. Concerning the impact of exchange rate volatility on the bank stock return volatility, the coefficient θ2 is found to be negatively significant in 9 out of 10 cases. These findings suggest that the fluctuations in exchange rates lead to a decrease in the bank stock return volatility which is contrary to what is usually expected. However, Pakistani banks may have been less exposed to significant exchange rate risk over the sample period. Moreover, Pakistani banks might have adequately hedged their exchange rate exposure using such instruments as cross-currency swaps and forward contracts. The findings are in line with those of Ryan et al. [19] but inconsistent with the results of Choi et al. [20] and Wetmore et al. [21].
In the face of rising volatility concerning interest rates and exchange rates owing to less regulatory pressures following the liberalization of global financial systems, there has been a surge in literature investigating the impact of interest rate and exchange rate volatility on bank stock returns. Unfortunately, developing (especially South Asian) economies have been greatly neglected over these years with reference to the surge in previously mentioned strand of literature. Most of the empirical studies have remained focused on the financial systems of developed economies where advanced risk management techniques have been present for hedging risks associated with interest rates and exchange rates as opposed to the situation in developing economies.
The developing economies lack risk management mechanisms since financial infrastructure is still at a nascent stage to facilitate their development. This has resulted in greater volatility in interest rates and exchange rates in developing economies. In order to fill this research gap, this study investigated a joint impact of interest rate, exchange rate and market risk on bank stock returns by employing both OLS, GMM, WLS and GARCH estimation models in Pakistan’s context.
WLS and GARCH estimation were found to be more reliable as compared to OLS estimation in the face of autocorrelation of residuals. We also considered the time-varying nature of interest rate and exchange rate sensitivities of bank stock returns using GARCH based risk models. Market return was found to possess greater explaining power as compared to interest rate and exchange rate risk. Interest rate and exchange rate volatility was found to have a significant negative impact on the bank stock return volatility.
The findings of our study entail some interesting insights for different categories of stakeholders including investors, bank managers, and central bankers. The findings of this paper provide important information to investors which might help them in revaluing banks' stocks. The results suggest that investors should follow the monetary policy more closely in their decision making process since interest rates and exchange rates have predictive powers on bank stock returns and volatility.
The tactical or strategic portfolio management should have a close look at the dynamics of interest rate and exchange rate and portfolio may be tilted accordingly. Bank managers can also benefit from our findings in the development of risk management strategies while focusing on prevailing monitory regime. They should also follow monetary policies when they build risk management strategies. Finally, policymakers should perform a thorough analysis of the banking system while developing monetary policy since it serves as the major facilitator in the policy implementation process.
1For detailed explanation of these theories, see Kasman et al. [1].
2Different ARCH series estimation models including GARCH with various (p,q) orders are analyzed based on Akaike Information Criterion (AIC) and Schwarz Information Criterion (SIC), GARCH (1,1) is found best among others based on criteria.
3A dummy variable to examine the impact of 2008-09 economic crises is introduced in conditional mean equation of GARCH (1,1) model, a significant impact on bank stock returns is found.
Copyright © 2025 Research and Reviews, All Rights Reserved