ISSN: 1204-5357
ISSN: 1204-5357
| AZIZUL BATEN, PhD Visiting Associate Professor, Department of Decision Science, School of Quantitative Sciences, Universiti Utara Malaysia Postal Address: Department of Decision Science, School of Quantitative Sciences Universiti Utara Malaysia, 06010 UUM Sintok, Darul Aman, Malaysia Author's Personal/Organizational Website: https://sites.google.com/site/mdazizulbaten/home Email: md.azizul@uum.edu.my or baten_math@yahoo.com Visiting Associate Professor Dr. Md. Azizul Baten currently is working in Department of Decision Science, School of Quantitative Sciences, Universiti Utara Malaysia, 06010 Sintok, Kedah, Malaysia and previously he had been working in Department of Statistics as a full Professor, Shahjalal University of Science and Technology (SUST), Bangladesh. His areas of interest are Stochastic optimization models in control and growth theory; Inventory production models; Stochastic frontier and Meta-frontier production function models; Data Envelopment Analysis. His research publications include papers in prestigious journals such as IEEE Transactions on Automatic Control, Stochastic Analysis and Applications, Journal of Applied Mathematics and Stochastic Analysis, Plos One etc. |
| MAZNAH MAT KASIM, PhD |
| Associate Professor Postal Address: Department of Decision Science, School of Quantitative Sciences Universiti Utara Malaysia, 06010 UUM Sintok, Darul Aman, Malaysia Author's Personal/Organizational Website: http://repo.uum.edu.my/profile/maznah Email: maznah@uum.edu.my Dr Maznah Mat Kasim is an Associate Professor at the Decision Science Department, School of Quantitative Sciences, Universiti Utara Malaysia. She is an active researcher, and currently is supervising post graduate students in the area of multi criteria decision modelling and multi-criteria performance evaluation |
| RAZAMIN RAMLI, PhD |
| Associate Professor Postal Address: Department of Decision Science, School of Quantitative Sciences Universiti Utara Malaysia, 06010 UUM Sintok, Darul Aman, Malaysia. Author's Personal/Organizational Website: https://sites.google.com/site/razaminr/ Email: razamin@uum.edu.my Dr. Razamin Ramli is an Associate Professor at the Department of Decision Science in the School of Quantitative Sciences, Universiti Utara Malaysia. Her main research interests are in optimization, meta-heuristics, evolutionary algorithms, planning and scheduling problems, and mixed-methods. Dr. Ramli is a member of the Management Science and Operations Research Society of Malaysia (MSORSM), and also a member of International Association of Computer Science and Information Technology (IACSIT). |
| JASTINI MOHD. JAMIL, PhD |
| Senior Lecturer Postal Address: Department of Decision Science, School of Quantitative Sciences Universiti Utara Malaysia, 06010 UUM Sintok, Darul Aman, Malaysia. Author's Personal/Organizational Website: https://sites.google.com/site/jastinimohdjamil/ Email: jastini@uum.edu.my Dr. Jastini Mohd. Jamil is currently a senior lecturer and researcher at the Department of Decision Science, School of Quantitative Sciences, Universiti Utara Malaysia. The majority of her research focuses on data mining issues related to pre-processing data analyses, especially the quality issues and handling missing data; and application of data mining models. She furthermore has interests in areas of partial least squares structural equation modeling as well as decision support system and other statistical techniques in solving problems in diverse area. |
Visit for more related articles at Journal of Internet Banking and Commerce
Bank Efficiency is important and receives greater attention as it plays an essential role in the economic development. This study formulated an appropriate stochastic frontier model to investigate the efficiency of banks traded on Kuala Lumpur Stock Exchange (KLSE) market during the period 2005-2009. All data were analyzed using the maximum likelihood method to estimate the parameters of stochastic frontier production model. Unlike the earlier studies which use balance sheet and income statements data, this study used market data as the input and output variables. It was observed that banks traded in KLSE exhibited a commendable overall efficiency level of 96.2% during 2005- 2009 hence suggesting minimal input waste of 3.8%. The technical efficiency effects were observed increasing over time. Among the banks, the COMS (Cimb Group Holdings) bank was found to be highly efficient with a score of 0.9715 and BIMB (Bimb Holdings) bank was noted to have the lowest efficiency with a score of 0.9582. The results also showed that Cobb-Douglas stochastic frontier model with truncated normal distributional assumption was found preferable than Translog stochastic frontier model.
Keywords |
| Technical efficiency; Stochastic frontier approach; Cobb-Douglas production function; Kuala Lumpur stock exchange. |
INTRODUCTION |
| Financial markets constitute an important part of the total infrastructure for every society, nation, country’s economic growth and stock market. The Malaysian stock market undertaken by Bursa Malaysia, formerly known as Kuala Lumpur Stock Exchange (KLSE), experienced a remarkable growth over the past four decades, both in terms of its operations and trading performance. In terms of market capitalization, the value of Malaysian shares has more than doubled during the period from the daily average of RM464.98 billion to RM1,106.15 billion in 2007. It is expected to grow from the RM1.3 trillion (US$433 billion) recorded in 2010 to a value of RM2.4 trillion (US$800 billion) in 2020 (Source: Securities Commission Malaysia). |
| Many researchers investigated technical efficiency of financial institutions used either method, parametric stochastic frontier approach (SFA) or non-parametric data envelopment analysis (DEA) (Berger and Humphrey, 1997). Since DEA and SFA differ both in structure and in implementation, empirical evidence showed that both methods provide significantly different efficiency scores. SFA employed a composed error model in which inefficiencies are assumed to follow an asymmetric distribution, usually the halfnormal, while random errors are assumed to follow a symmetric distribution, usually the standard normal (Aigner et al., 1977). Efficiency analysis studies of financial institutions are available in Forsund et al. (1980), Schmidt (1986), Bauer (1990), Battese (1992), Greene (1993), Krikley et al. (1995), and Hasan et al. (2012). Most past studies used the half-normal and truncated normal distribution as assumption on the inefficiency effects model because of the ease of estimation and interpretation (Kirkley et al., 1995). This empirical study of SFA will be checked whether the half-normal or truncated normal assumptions on the technical inefficiencies to be an appropriate. |
| In this study, the SFA is considered to measure the technical efficiencies of selected banks in KLSE market in Malaysia instead of DEA; because of the advantage of SFA which deals with stochastic noise and also allows statistical tests of hypotheses concerning production structure and degree of inefficiency. DEA is not considered here because it does not impose any assumptions about production functional form and does not take into account random error; hence the efficiency estimates may be bias if the production process is largely characterized by stochastic elements (Kasman and Turgutlu, 2007). This study will be formulated the appropriate stochastic frontier model either Cobb-Douglas or Translog for the technical inefficiency effects based on Likelihood-Ratio test in frontier production function followed by the work of Battese and Coelli (1992). |
| A time-varying inefficiency effects measure either assuming truncated normal or half normal distribution based on Likelihood–Ratio test statistic will be adopted here. The objective is to identify the determinants which may influence the share market in KLSE. |
| This study seeks evidence on whether factors such as market return, market capitalization, and book-to-market ratio are significantly related to stock returns. Finally it will examine not only the capital market behavior of KLSE market in Malaysia but also exhibit the technical efficiencies for the respective traded banks.s |
METHODOLOGY |
| Stochastic Frontier Model with Technical Efficiency Effects |
| The stochastic frontier model for panel data can be written as: |
| where, |
| Where η is an unknown scalar parameter to be estimated, which determines whether
inefficiencies are time-varying or time invariant; and Uit ‘s are assumed to be i.i.d. and
truncated at zero of the |
| Uit denotes the specifications of the inefficiency model in equation (2). |
| Selecting the Functional form of the Stochastic Frontier Model |
| Generally, two types of model (Cobb-Douglas and Translog) are used in the SFA analysis. Actually, Cobb-Douglas production function is a special form of the Translog production function. It is important to find which functional form is appropriate in this SFA analysis. So, to select the best specification (Cobb-Douglas or Translog), a hypothesis test was conducted by using the generalized likelihood ratio (LR) test statistic: |
| where, L(H0) and L(H1) are the values of the log-likelihood function for the frontier model under the null and alternative hypotheses. |
Tests of Hypothesis |
| A series of formal hypotheses were obtained using the generalized likelihood ratio test which was given in (4). This test statistic is assumed to be asymptotically distributed as a mixture of chi-square distribution with degree of freedom equal to the number of restrictions involved (Taymaz and Saatci, 1997). The null hypotheses are rejected when the test statistic (λ ) exceeds the critical value of Kodde and Palm (1986). So, the following hypotheses were tested here: |
| (i) H0: γ=0 , it says that the technical inefficiency effects are not present in the model. |
| (ii) H0: µ=0 , it means that the half-normal distribution is better than the truncatednormal distribution for technical inefficiency effect. |
| (iv) H0: φ=0, it refers that the coefficients of the squared and interaction terms of input variables are zero or Cobb-Douglas production function is more preferable than Translog production function. |
Data Sources and Variables Construction |
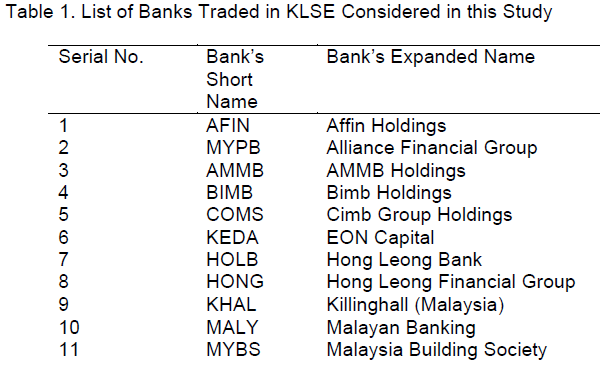
| The data collected from Kuala Lumpur Stock Exchange (KLSE) market consisting 14 banks in Malaysia for the period of 2005 to 2009. There are 14 banks traded in KLSE market as follows in Table 1. |
 |
 |
Dependent Variable |
| Individual Return (Y ): In this study, we take individual bank’s return as a dependent variable. KLSE prepares individual bank’s daily closing price. Using the closing price of individual bank we calculate the return of individual bank as follows: |
| Where, Pt = closing price at period Pt-1= closing price at period t-1 and ln = natural log. |
| In order to obtain the individual bank’s return, bank’s dividend, bonus and right issues are not adjusted since many researchers confirmed that their conclusions remained unchanged whether they adjusted their data for dividend, bonus and right issues or not (Lakonishok and Smidt, 1988; Fishe et al., 1993). The reasons to take logarithm returns are justified by both theoretically and empirically. Theoretically, logarithmic returns are analytically more tractable when linking returns over longer intervals. Empirically, logarithmic returns are more likely to be normally distributed which is a prior condition of standard statistical techniques (Strong, 1992). |
Independent Variables |
| Market Return ( X1 ): KLSE prepares daily price index from daily weighted-average price of daily transaction of each stock. The name of the index is “All Share Price Index”. Market return is calculated as follows: |
| where, Pt = price index at period t; Pt-1 = price index at period t-1 and ln = natural log. |
| Market Capitalization (X1): Market Capitalization is the total value of a bank’s issued share capital as determined by its share price in the stock market. It is calculated as the number of ordinary shares in issue multiplied by the previous day's closing share price and is expressed in millions. The formula is the following: |
| Market Capitalization = (Previous day’s closing share price * Shares in issue) |
| Book to Market Ratio (X3): The book value of a bank or company is total assets minus intangible assets and liabilities. Here we took the bank’s net asset value per share as a book value of that bank. The market value is the share value in the current market price. After establishing the book value and the market value of a bank simply dividing the book value by the market value we got the book to market ratio as: |
| Book to Market Ratio = (Book value/Market value). |
Empirical Cobb-Douglas Stochastic Frontier Model |
| The specification of Cobb-Douglas functional form can be expressed followed by Battese and Coelli (1992) with the decomposed errors: |
| where, the subscripts i and t represent the i-th bank and the t-th year of observation, respectively; i =1,2,...,14, t =1,2,...,5; |
| YIt : represents the individual return; |
| X1: represents the market return; |
| X2 : represents market capitalization; |
| X3 represents book to market ratio; |
| ln refers to the natural logarithm; |
| the β ’s are unknown parameters to be estimated; |
| VIt follows N(0, σ2v) and it U follows a half-normal or truncated normal distribution at zero and guarantees inefficiency to be positive only. |
RESULTS AND DISCUSSION |
| Results from Hypothesis Test |
| Formal tests of various hypotheses were carried out using the LR statistics and the results are presented in Table 2. The first hypothesis H0: γ = 0 was rejected, which indicated that there were technical inefficiency effects in the model. This implied that the technical inefficiency effects associated with the banks of KLSE market were significant. The second hypothesis H0: µ=0 was rejected, which meant that the truncated-normal distribution was found preferable to the half-normal distribution for technical inefficiency effect. So, truncated-normal distribution was selected for the inefficiency effects of KLSE market data. |
| The third hypothesis : H0: φ=0 = was accepted, which indicated that Cobb-Douglas production function was preferable than Translog production function. |
 |
OLS Estimates of Cobb-Douglas Stochastic Frontier Model |
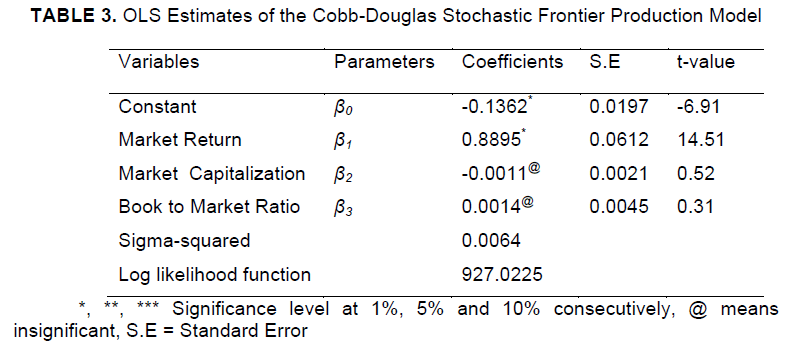
| The ordinary least square (OLS) estimates of the parameters of Cobb-Douglas production function were obtained by grid search in the first step. The ordinary least square estimates showed the average performance of the banks that were presented in Table 3. From the analysis, we observed that the coefficients of market return was found to be significant at 1% level of significance with the value 0.8895 while the coefficients of market capitalization and book to market ratio were found insignificant with the values - 0.0011 and 0.0014 respectively. These results indicated that these input variables significantly affected the amount of return in individual banks listed in the KLSE market for truncated normal distribution. There was an insignificant negative relationship between shares return with market capitalization and positive relation with Book to market ratio which showed the contradiction to some studies (e.g., Banz, 1981; Chan et al., 1991 and Fama and French, 1992; Perera, 1995 and Claessens et al., 1996). Also, there is an insignificant positive relationship between the book-to-market ratio and stock returns which contradict in the emerging market research (Claessens et al, 1996). The market return showed significant relationship with the stock returns which meant that the overall market rises and then the return of individual banks will increase. The parameter σ was positive, which indicated that the observed output differed from frontier output. |
 |
Maximum-Likelihood Estimates of Cobb Douglas Stochastic Frontier Model |
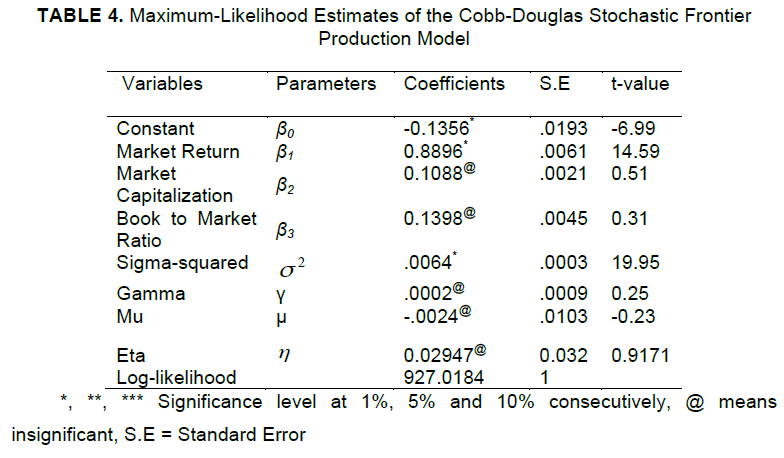
| The maximum likelihood estimates of the parameters of Cobb-Douglas stochastic frontier production model were presented in Table 4. From the analysis, it was observed that the coefficient of market return was found to be significant at 1% level of significance with the value 0.8896 while the coefficients of market capitalization and book to market ratio were found insignificant with the values 0.1088 and 0.1398 respectively. These results indicated that the input variable, market return significantly affected the amount of return in the banks listed in the KLSE market for truncated normal distribution. The market return showed significant positive relationship with the stock returns. The other two input variables market capitalization and book-to-market ratio showed insignificant positive relationship with the stock returns. These findings are similar to the findings that we obtained for time-variant case in OLS regression. The estimate of the η parameter in inefficiency effect model was found positive and it was indicated that the technical inefficiency effects tended to decrease over time. It was evident from Table 4 that the estimate of σ2 was recorded 0.0064 and it was significantly different from zero, indicating a good fit. |
 |
Efficiency of Banks Traded in KLSE |
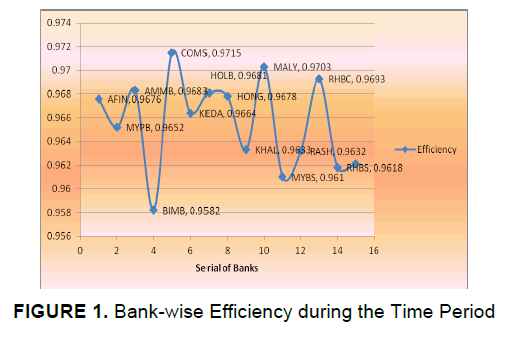
| This study examined the bank-wise efficiency individually traded in Kuala Lumpur Stock Exchange (KLSE) during 2005-2009 by applying Stochastic Frontier Approach (SFA). The bank-wise efficiency was illustrated in Figure 1. It was observed that on the average, banks were 96.2% percent efficient on the best performing bank during the study period. In other words, the sample banks had wasted on average 3.8% percent of their inputs. The most efficient bank during the study period was found to be COMS (Cimb Group Holdings) bank with a score of 0.9715 and the least efficient bank during the data period and BIMB (Bimb Holdings) bank with a score of 0.9582. Efficiency estimation is helpful for individual investment or loan decisions. Creditors and investors can review the past performance and current position of banks by using efficiency results. Moreover, banks can improve their overall performance by taking decision from the efficiency results. |
 |
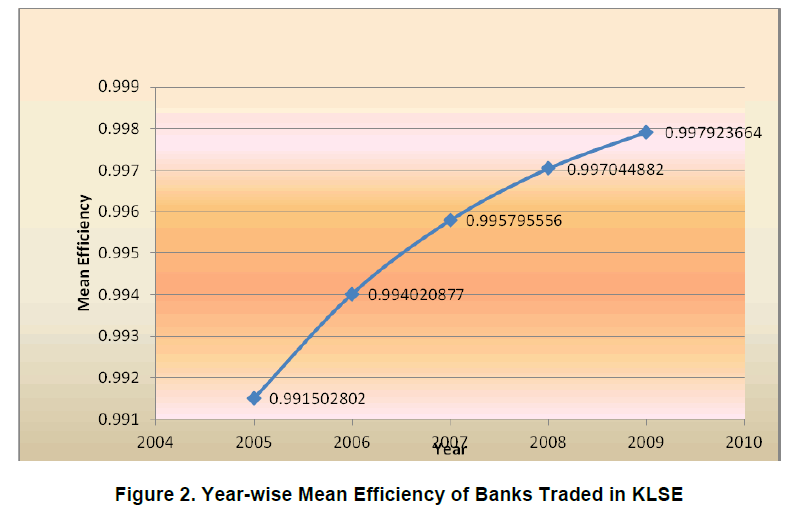
Year-wise Mean Efficiency of Banks Traded in KLSE |
| The mean efficiency of 14 companies in KLSE market with time-variant was presented in Figure 2. It was recorded that the range of mean efficiencies values varied from 0.9915 to 0.9979. The overall mean technical efficiency of the banks in KLSE during the period 2005 to 2009 was observed 0.9952 and it indicated that 99.52 percent of potential outputs were being realized by the banks in KLSE market. So, the sampled banks in KLSE market had wasted an average of 1.5 percent of their inputs only. From the investigation, it was found that the highest mean efficiency was 0.9979 in 2009, while the lowest mean efficiency was 0.9915 in 2005. The mean technical efficiency was increased over time. However, an earlier study (Sufian, 2004) observed a score of 95.9 percent whereas (Katib et al., 2000) recorded the score ranging from 68 to 80 percent for Malaysian banks. |
 |
CONCLUSION |
| The study formulated an appropriate KLSE market oriented bank efficiency stochastic frontier model and provided evidence the determinants of share returns on the KLSE. Cobb-Douglas frontier model was found better than Translog model with the truncated normal distributional assumption based on Likelihood-Ratio test statistic. The results suggested that the input variable market return has a significant influence on share returns and it indicated that this input variable significantly affected to the individual bank’s return in the KLSE market. The truncated normal distribution was found to be preferable to the half normal distribution for the inefficiency effects of KLSE market data. On the average, banks were observed 96.2% percent efficient on the best performing bank during the study period. The most efficient bank was recorded to be COMS (Cimb Group Holdings) bank and the less efficient bank was found to be BIMB (Bimb Holdings) bank. The overall mean technical efficiency of the banks in KLSE is 0.9952 over time indicating that 99.52 percent of potential outputs were being realized and had wasted an average of 1.5 percent of their inputs only by the banks in KLSE market. |
| These results is of great interest to academics, policy makers and local and foreign listed and unlisted companies and have important practical implications to different capital market participants such as investors, managers and regulatory authorities. It may also be useful for international organizations (such as the World Bank, IMF, WTO) and governments of development partners who are interested in the development of capital markets in the emerging countries. In this way the stock market can play an important role in inducing economic growth in Malaysia by channeling investment where it needed from public. |
ACKNOWLEDGMENTS |
| The authors wish to acknowledge the financial support provided by the HIGH IMPACT GROUP RESEARCH GRANT PENYELIDIKAN BERKUMPULAN IMPAK TINGGI (PBIT), (Grant number: 12870), Universiti Utara Malaysia, Sintok, Kedah, Malaysia, for conducting this research. |
| REFERENCES |
Aigner, D. Lovell, C.A.K., & Schmidt, P. (1977). Formulation and estimation of stochastic |
Copyright © 2025 Research and Reviews, All Rights Reserved