Keywords
|
| information systems, internet, e-learning |
INTRODUCTION
|
| The University of Finance and Management (WSFiZ) in Białystok received the EU financial resources in the academic year 2009-2010 within the project entitled “Development Programme of WSFiZ in Białystok” No. POKL.04.01.01-00-030/08 within the Human Capital Operational Programme, Sub-measure 4.1.1 Strengthening and development of didactic potential of universities, co-financed by the European Union within the European Social Fund. |
| “Development Programme of WSFiZ in Białystok” is an initiative aimed at improvement of the quality of higher education in Poland. Activities listed in the project have been planned to increase the practicality of transferred knowledge and to provide students with vital and unique skills in a modern labour market. The project consists of four parts: implementation of e-learning in teaching, expansion of teaching programmes by innovative technologies GIS (Geographic Information System), support for the academic Career Centres in realization of their activities aimed at a rise in the number of students and graduates in the labour market, and also introduction of new fields of postgraduate studies. The project was intended to support 820 direct beneficiaries: 545 students and graduates, 125 students of postgraduate studies, 150 teachers (N. Siemieniuk, R. Mosdorf, 2009). |
| The implementation of e-learning in the University of Finance and Management in Białystok started in September 2008 and finished in September 2009. The process of implementation of e-learning took place in stages. Time brackets of its realization were determined for individual stages as well personal responsibility for realization of each stage. |
| The result of the EU project in WSFiZ in Białystok connected with the implementation of elearning is an e-learning centre in the form of a computer laboratory for students and university teachers of WSFiZ in Białystok, equipped with computer hardware and software essential to conduct training courses and classes preparing teachers and students for distance learning. There were 100 university teachers trained in the e-learning centre within the Moodle platform, as well as software used to create and manage the content of training. The number of training hours for university teachers included 300 hours. Within the project a subject Designer of e-learning courses was initiated in full-time and part-time studies, 35 hours in full-time studies and 35 hours in part-time studies, total number of hours for the subject Designer of e-learning courses was 630. Within the EU project pilot e-courses in 10 subjects were initiated: Financial Analysis, Linear Algebra, Law, Marketing, Architecture of Computer Systems, Statistics, Finance, Macroeconomics, VBA Programming, Information Technologies in Capital Markets, 30 hours in full-time studies and 12 hours in part-time studies for each listed subject, total number of classes conducted from a distance was 420. More than 180 students of WSFiZ in Białystok took part in classes. Before they started distance learning, the students were trained in using the Moodle platform. The project was a success, each subject was assessed in a positive way by students in an anonymous survey, the average mark ca. 4.2. |
| From the beginning of the project a programmer has been adjusted the functionality of the existing system of the university management (Recto) to requirements of the Moodle elearning platform. The aim of an integration was to create a logical connection between two software systems: “Recto” and “Moodle”. “Recto” is an assistance system of the university management, created and used by the University of Finance and Management in Białystok. “Moodle” is a management system with an open source software, chosen by consultants of the Priority as a software to be an e-learning platform in the University of Finance and Management in Białystok. The essence of the project is to minimize amount of labour, which users of systems would have done if they had been completely independent. A huge emphasis was put on the least possible interference into existing structures of the systems. The Learning Management System (LMS) records activity of many users: students, teachers and administration workers. Each student using the LMS can be treated as dynamical system whose activity is caused by LMS, but system activity results from activity of teachers and university administration. Each of the mentioned users can be treated as dynamical system as well. It means that e-learning system is a virtual place where thousands of dynamical systems (users) communicate each others. These communication leads to changes of users’ activities. The users (human) behavior is nonlinear (Sulis et al., 1995), therefore we can say that LMS is a virtual platform of interaction of nonlinear dynamical systems (Ignatowska et al., 2005; Ignatowska et al., 2008). In case of LMS system the number of logs of each user is a one of the measure of his activity, therefore in the paper the dynamics of changes in time of logs to LMS have been analyzed. The dynamics of changes of logs to LMS have been analyzed in the paper using the recurrence plot method. |
2. Attractor reconstruction
|
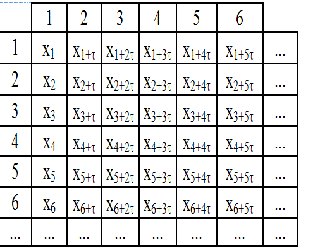
| The trajectories of the chaotic system in the phase space do not form any single geometrical object such as circle or torus, but form objects called strange attractors of the structure resembling the one of a fractal (Schuster, 1984). Non linear analysis starts from attractor reconstruction. Reconstruction of attractor in certain embedding dimension has been carried out using the stroboscope coordination. In this method subsequent co-ordinates of attractor points are calculated basing on the subsequent samples distant of time delay . The time delay is multiplication of time between the samples. For the measured data in the form of time series: {x n } = n{ x x , x ,..., x 1 2 } the way of calculation of subsequent coordinates of points of attractor is shown in Fig.1. |
| The image of the attractor in n-dimensional space depends upon time-delay . When the time-delay is too small, the attractor gets flattened, that makes further analysis of its structure impossible. The selection of time-delay value is of great significance in the analysis of the attractor properties. Therefore the analysis of the experimental data is initiated by determining the time-delay. For that purpose the autocorrelation function is calculated. Autocorrelation function allows identification of correlation between the subsequent samples. In case of chaotic data the value of autocorrelation function rapidly decrease when increase. Value of the time-delay is determined from the condition C( ) 0.5*C(0) (Schuster, 1984). |
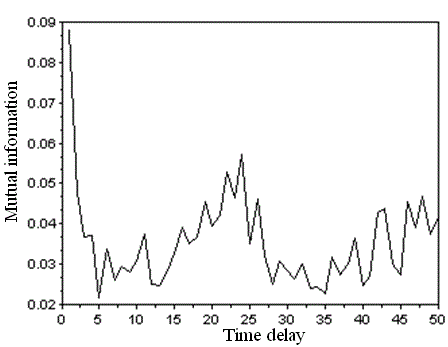
| The method of calculation of the mutual information can be also used to determine proper delay coordinates for reconstructed attractors. In this case two time series are considered, X(t) and X(t+τ). As τ is increased, I(τ) decreases, then usually rises again. τ for which I obtain the first minimum is a proper value of τ. The mutual information of two discrete random variables X and Y can be defined as (Marwan et al., 2007): |
 |
| where p(x,y) is the joint probability distribution function of X and Y, and p1(x) and p2(y) are the marginal probability distribution functions of X and Y. |
| The mutual information is nonnegative, is equal to zero if X and Y are independent random variables. The examples of mutual information calculated for data from the third data set are presented in Fig. 2. |
3. Recurrence plot
|
| Recurrence plot (RP) visualize the recurrence of states xi in a phase space. The RP enables us to investigate the recurrence of state in m-dimensional phase. The recurrence of a state at time i at a different time j is marked within black dots in the plot, where both axes are time axes. From the formal point of view the RP can be expressed as (Marwan et al., 2007): |
 |
| where N is the number of considered states xi, εi is a threshold distance, a norm and Θ the Heaviside function. |
| Homogeneous RPs are typical of stationary systems in which relaxation times are short in comparison with the time of system investigation. Oscillating systems have RPs with diagonal oriented, periodic recurrent structures. For quasi-periodic systems, the distances between the diagonal lines are different. The drift is caused by systems with slowly varying parameters which cause changes of brightens the RP's upper-left and lower-right corners. Abrupt changes in the dynamics as well as extreme events cause white areas or bands in the RP. |
| Single, isolated recurrence points can occur if states are rare, if they do not persist for any time or if they fluctuate heavily. However, they are not a unique sign of chance or noise (for example in maps). A diagonal line occurs when a segment of the trajectory runs parallel to another segment. The distance between trajectories is less than ε. The length of this diagonal line is determined by the duration of this phenomenon. A vertical (horizontal) line indicates a time in which a state does not change or changes very slowly. The recurrence rate (RR) represents the percentage of recurrence points in RP (Marwan et al., 2007): |
 |
| The recurrence rate corresponds to the correlation sum (Marwan et al., 2007). |
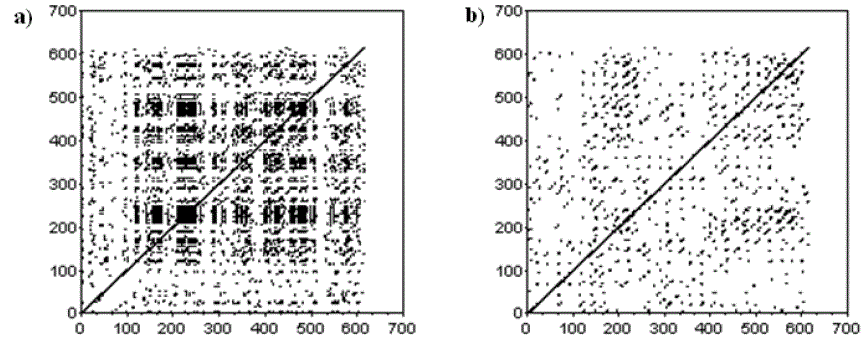
| In Fig. 3 the recurrence plots for the time series of number of requests of Moodle e-learning platform per hour have been presented. |
| The results obtained for that data set show that using the university’s Moodle platform by the teachers is more complex phenomenon than the students’ activity. What is more, the teachers’ behaviour seem to be similar to the main university’s web-site users logging schema during the learning time. |
4. Users’ activity in the selected courses
|
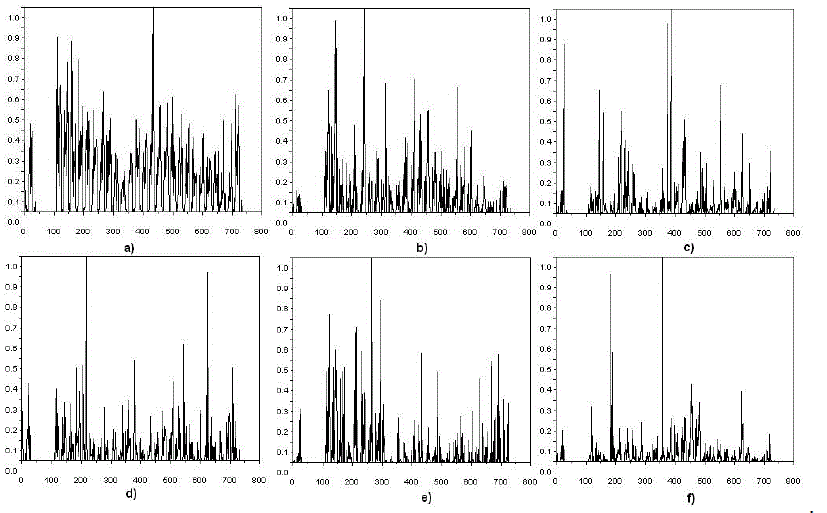
| The analysed data set contains time series of all active users who participated in the project and five subseries for the particular courses: statistics, finance, macroeconomics, algebra and law. All data sets include users activity in two groups of full-time and extramural studies. Each time series was subjected to the process of normalization of data. The results obtained for the data specified above are shown in Fig. 4. |
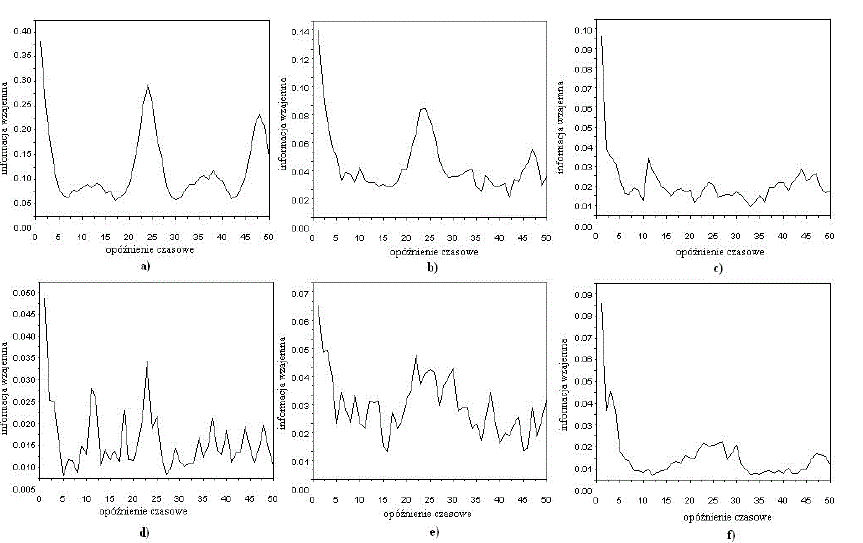
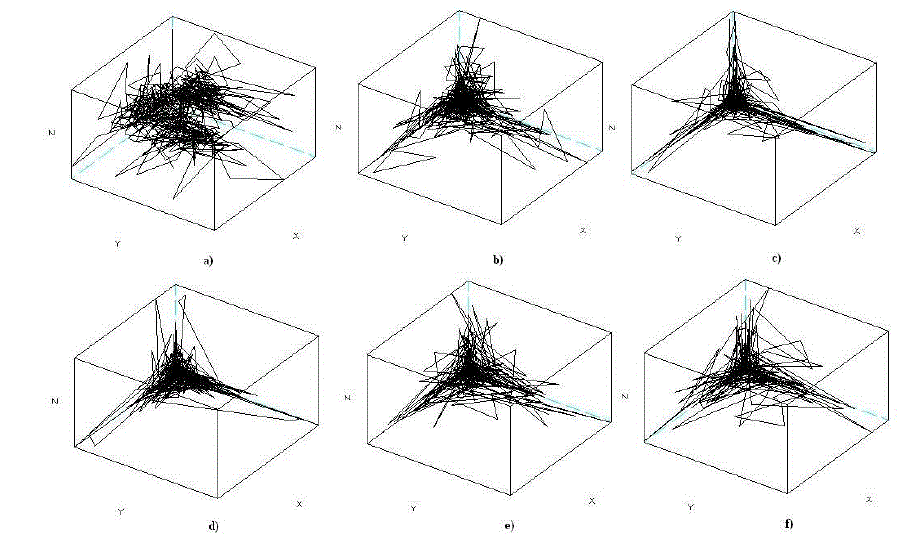
| The data sets for each of the courses contain about 730 observations. Distribution of frequency of logins to the e-learning system varies for each course. The maximum and minimum number as well as the average number of logins are also observed in different periods. The value of time delay was chosen on the basis of mutual information function. The first minimum of observed values is the optimal time delay. The mutual information plots for analysed data sets are shown in Fig. 5. In Fig.6 the attractor reconstructions have been shown. |
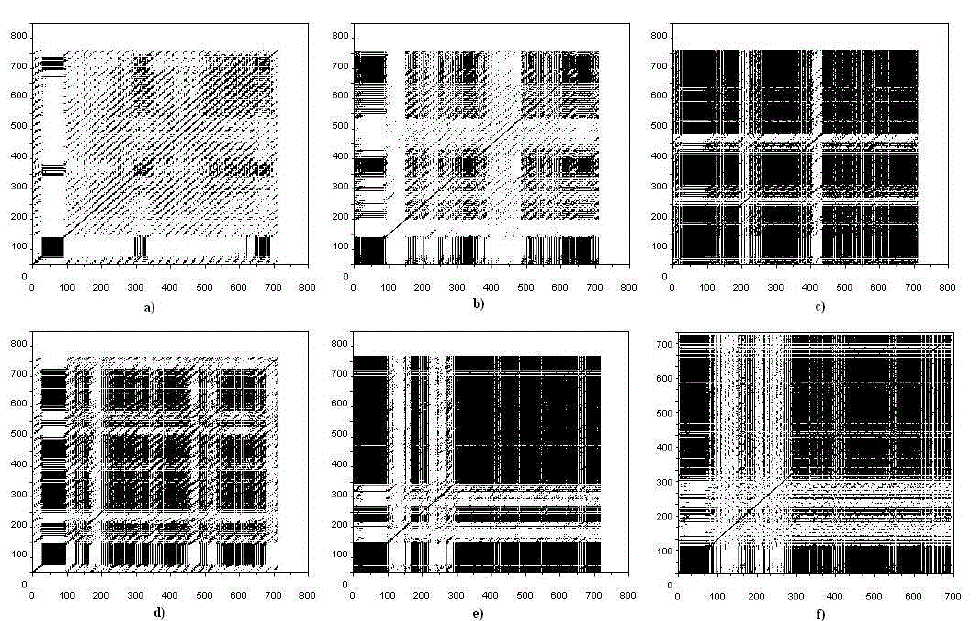
| The recurrence plots shown in Fig.7 show quite large variations for each data subseries. The structure of each charts have certain features in common, however distribution and density of recurrent points clearly distinguishes each time series. There are larger or smaller clusters of points in each graphs. These clusters proves an irregular behavior of the system. Some long vertical or horizontal structures indicate periods when the activity log does not change (minor variations are permitted in accordance with the amplitude error). |
5. Conclusion
|
| In case of the main data set that contains all the activities there are some short diagonal lines spaced at equal intervals. This might mean that there are some cycles of similar activity in the system that lasts only for short periods. The recurrence plot obtained for the statistics subseries seems to be more interesting. The main part of that RP are four square clusters of points of a similar size distributed in some distance from each other (both vertical and horizontal). This implies the existence of areas where users activity is similar one to another. What is more the changes of the activity follow some similar patterns over time. Subsequent plots contain relatively large areas of recurrent points which may provide a uniform amplitude activity (within the error margin). Such an uniform structure of the charts is disordered by far higher (or lower) moments of activity. Although this pattern is characteristic for several courses (finance, macroeconomics, algebra, law) each RP might be distinguished from all the figures. As it was proved the graphical data analysis methods yield interesting results. The differences and similarities between analysed signals can be shown more clearly than by using parametric methods only. |
| At the end of the project all of the courses were evaluated by students. The difficulty and complexity of the course was among the others the criterion of its evaluation. According to the students’ opinion the finance, algebra and law were the most difficult courses whereas statistics and macroeconomics were indicated as not too difficult. The percentage ratio of recurrence points in RP is estimated by RR coefficient (3). For the difficult courses the RR coefficient is higher than for the other courses. The comparison between the results of e-learning courses evaluation made by students and RP analysis allow us to withdraw the following conclusion: the increase of complexity and difficulty of the course causes the increase of RR coefficient. |
Figures at a glance
|
 |
 |
 |
 |
| Figure 1 |
Figure 2 |
Figure 3 |
Figure 4 |
 |
 |
 |
| Figure 5 |
Figure 6 |
Figure 7 |
|
| |
References
|
- Ignatowska, B. & Mosdorf, R. (2008). Analiza dynamiki odwiedzin wy branych internet owychstron serwisu internet owego WSFIZ. In: Zasto sowanie technologii inform acyjnych dowspom agania zarzadzania procesami gospodarczymi, Siemieniuk, N. & Mosdorf, R.(Ed.), pp. 209-219, Wyda wnictwo WSFiZ, Bialystok, (in Polish).
- Ignatowska, B. & Mosdorf, R. (2005). Nonlinear analysis of e-learning system in University of Finance and Management in Bialystok. ACS - CISIM International Multi-Conference on Advanced Computer Systems - ACS and Computer Information Systems and Industrial Management Applications - CISIM. ISBN-83-87256-86-2, Vol.2, pp. 65-73,Wydawnictwo WSFIZ, Bialystok.
- Marwan, N.; Romano, M. C.; Thiel, M. & Kurths, J. (2007). Recurrence Plots for the Analysis of Complex Systems, Physics Reports, 438(5-6), pp. 237-329. Recurrence Plots And Cross Recurrence Plots (www.recurrence-plot.tk).
- Schuster, H. G. (1984). Deterministic chaos an introduction, Physik- Verlag GmbH, Weinheim.
- Sulis, W. & Combs, A. (1995). Nonlinear dynamics in human behavior, Studies of Nonlinear Phenomena in Life Science. Vol. 5. World Scientific Publishing.
- R. Mosdorf, J. Kilon and B. Ignatowska (2010), Dynamic analysis of activity of e-learning system users. E-learning, Book edited by: Marina Buzzi, ISBN: 978-953-7619-95-4:INTECH.
- N. Siemieniuk, R. Mosdorf (2009), Wybrane zagadnienia wdrazania e-learningu w szkole wyzszej na przykladzie WSFiZ w Bialymstoku, Wyd. WSFiZ, Bialystok, ISBN 978-83-60432-54-9 (in Polish)
|