ISSN: 1204-5357
ISSN: 1204-5357
Associate Professor, The American University of Nigeria, Adamawa, Nigeria
Oluwatunmise E Tesunbi
The American University of Nigeria, Adamawa, Nigeria
Visit for more related articles at Journal of Internet Banking and Commerce
This study measured the intention of customers to adopt e-banking in Dubai and the extent to which certain factors impact e-banking adoption. Variables measured included perceived ease of use (PEU), perceived usefulness (USFL), perceived web security (PWS), and attitude (ATTD) of the users. Results show that PEU, USFL, and PWS have a direct and positive impact on customer attitude (ATTD). Results also show that a majority (41% or 26%) of the respondents strongly agreed or agreed respectively. Respondents reported that overall, the use of internet banking services is easy. Finally, a majority (44%) of the strongly agreed and agreed respondent reported that Internet banking is a safe (PWS) place to transmit sensitive data.
E-banking; Technology Acceptance Model; Internet banking; customer attitude, perceived ease of use; perceived usefulness; perceived web security.
Computers and the Internet have revolutionized how humans conduct their lives; just about every aspect of daily activities is now run, or organized, by some form computer processing. Arguably, some drawbacks, e.g., credit card fraud, advance fee fraud, Internet auction scams, stock inflation scams, pyramid schemes, emails telling about sharing a large amount of money, Chunga, et al. [1] are emerging with appreciable frequency. However, a considerable number of the changes, as well as a sizeable number of encouraging facets of technological development, have been most advantageous, and, therefore, welcomed, particularly because of the vast improvement we now experience. From music, to education, sports, transportation, commerce, Internet towers like a Colossus. Take financial services, for instance. Probably one of the most prevalent, or pervasive, outcomes of this new trend is [secure] e-banking. With the proliferation of Internet adoption, banking service, courtesy of electronic platform, has become ideal for commercial banks in order to meet burgeoning customer’s financial needs.
Though e-banking is common and widely used today, some people still do not see any reason they should do their banking on the Internet. Despite this, e-banking is trending, especially in the developed countries, where the Internet operation remains at low costs. One researcher, Porteous [2] suggested two major advantages of the new trend in banking services:
• It has increased the efficiency of payment systems and reduced reliance on cash transactions.
• It has expanded access to financial services by increasing accessibility and lowering the cost of offering formal financial services.
Thus, the trend is growing on bank customers, changing attitude in the process.
This study was informed by two primary ideas;
• Attitude of customers toward e-banking.
• The impact of customer attitude on their intention to use e-banking.
The researchers considered three factors that influence people’s attitude toward e-banking;
• Ease of use.
• Perceived usefulness.
• Perceived web security.
The remaining part of the research paper is structured as follows; Purpose of this Study, Review of Literature, Research Problem and Hypothesis, Methodology, Reliability Construct, Profile of Respondents, Findings, Limitations, Implications for Academics and Practitioners, Recommendation, and Conclusion.
According to Akinci, et al. [3] advancement in technology triggered the improvement in banking services through a more efficient and affordable platform, other than the brick-and-mortar model. The key driver of this school of thought is convenience; that is convenience within the context of time between transaction and comfort of usage anywhere. Singh and Kaur [4] affirmed that e-banking saves time of both customers and the bank workers. Some of the transactions available on e-banking platform include access to customers account, fund transfer between customers using the same the bank, fund transfer to other banks, purchase of flight tickets, bill payment, purchase of recharge cards, and so on [5].
By way of definition, therefore, e-banking involves the provision of certain bank services to bank customers on certain computing devices, some of which include personal computer, iPad, tablet, mobile phone, etc. Faizal [6] estimates that the percentage of mobile phone users is higher in United Arab Emirates than other Middle East countries; this estimate is projected to increase by 200% in the next five years. The continuous growth in population of mobile phone users, as well as wide spread, convenient internet use, has to motivate Banks in Dubai to design e-banking to satisfy and service the customers on the go.
In effect, e-banking has made transactions convenient, quick, and time-saving for customers in real time. Banks are also substantial beneficiaries of e-banking. It has helped banks to service customers better, reduce cost, increase profit, and so on.
Despite the plethora of e-banking benefits, some customers are sensitive and reluctant about using it. Their fears, and reluctance, can be traced primarily to a cocktail of factors, including security, lack of computer skill, lack of Internet access, etc.
The study measured
• Customers’ attitude toward e banking.
• Degree of customer’s attitude toward e-banking adoption.
• Degree of influence of customer attitude on customer intention to use e-banking.
• Degree of ease-of-use, usefulness and perceived web security on customer attitude.
A number of seminal studies have demonstrated the relationship between perceived usefulness of e-banking on adoption of e-banking and the influence of perceived ease of use of e-banking on its adoption. One example is Geetha and Malarvizhi [7] investigated the influence of perceived usefulness, perceived ease of use, and perceived risk on the decision of bank customer to adopt e-banking. Using a convenient sampling, they interviewed 200 subjects from 19 different banks in Coimbatore, Tamul Nadu, India. Findings show that all three constructs, i.e., perceived ease of use, usefulness, and perceived risk, were reliable enough to be used, and all have a significant influence on customer’s decision to use e-banking. Most transactions on e-banking platform are quick but not free; therefore, no one uses e-banking for the fun of it. Most customers who use it do so because of the benefits they derive from the platform. Natuarlly, banks would want to add more facilities to e banking to increase its usefulness to customer and also make it more user-friendly to encourage new users to sign up for it. Our research supported this notion.
Wai-Ching [8] investigated the factors that determine users’ adoption of e-banking among Malaysians. Based on a 10-attibute grouping-including accessibility, features availability, bank management and image, security concerns, privacy, design, content, speed, and fees and charges-a 5-point Likert questionnaire was administered to 324 respondents. Findings showed that regarding users’ adoption of e-banking services, the ten selected variables are significant. Primary dissatisfaction sources stemmed from security and privacy; however, accessibility, convenience, design and content were reported to be the sources of satisfaction. Also, product features availability, speed, bank’s operations management, reasonable service charges, and/or fees determine the e-banks’ success. In addition, considering the users’ acceptance of e-banking services with respect to different segmentation of age groups, education level, and income level, findings showed that security, privacy and convenience are critical. In our study, GPRS, WAP and 3G from mobile devices have no significance or influence in the adoption of e-banking services.
Furthermore, in our research, we did not put source or Internet service provider into account; however, the findings showed perceived usefulness and perceived web security as being crucial. Generally, web security is [almost] every e-banking user’s concern, as no one wants to lose money due to Internet fraudster or hacker criminal acts. With more empirical research, for example, Nadim and Noorgahn [9], which is reviewed in the next paragraph, useful data can help provide ways to achieve tremendous reduction in risks associated with e-banking over the next decades.
Nadim and Noorjahan [9] conducted a research on the role which customers perceived usefulness, perceived ease of use, e-banking privacy and safety, and the customer’s attitude play in adoption of e-banking in Bangladesh. Data from a sample 227 subjects showed that all five constructs were very reliable, and customers perceived e-banking to be useful and easy to use. E-banking users also perceived that the platform is safe for conducting bank transactions, and the users reported having favorable attitude toward e-banking. Most bank customers also reported having positive intention to adopt e-banking in the future.
Indeed, e-banking is considered to be useful, but not all e-banking platform is easy to navigate, as platform varies from bank to bank; As such, a user must be patient, moderately skilled with the use of computer, and triumph above all minor challenges before he or she can get a transaction done. According to Howcroft, Hamilton and Hewer [10] most customers have confidence and trust in the bank they use, but they have less trust and confidence in technology for e-banking. This could be because face-to-face transactions make business activities more real to the customer than transacting through an intermediary, i.e., computer and Internet.
Masocha, et al. [11] surveyed 100 bank customers from various banks in Alice Town, Eastern Cape Province of South. The majority of the respondents reported that they were attracted to banks which use advanced banking technologies. However, relatively few customers used Internet and mobile phone banking; instead, the majority of respondents preferred modern banking to the brick-and-mortar. “Unfortunately, there is a huge gap between ownership and usage of e-banking resources entailing that there is no effective utilization of technologies owned by rural customers.” Our research, and that of Macho et al paper, showed relatively the same objectives; the similarity, however, ends there. The adoption of e-banking in Dubai is appreciably higher than in Alice, South Africa, as findings show in the next paragraph.
The results in the South African study are not so different from the findings from another exploratory research. Using the diffusion of innovation as anchor, Thulani, et al. [12] examined the extent of adoption and usage of Internet banking by commercial banks in Bindura, Zimbabwe. They also studied the challenges banks faced in a bid to adopt e banking technology. Their findings reveal that in view of the extent of Internet banking adoption, a majority of the banks have adopted this technology and are using the service to reach and serve their clients (corporate and individual customers). In spite of the relatively high adoption rate by banks, the number of people using the technology is relatively low. That is why the study suggested that banking sector in Zimbabwe should vigorously promote the usage of Internet banking among customers. They also admonished the Reserve Bank of Zimbabwe to “increase investments targeted at infrastructure development so as to encourage banks and individuals alike to adopt the innovation.” Our study’s recommendation is not so different from this school of thought.
Brown and Molla [13] however, did something slightly different, but with the same basic subject matter: e-banking. They compared the perceptions of Internet banking and cell phone banking adoption in South Africa. A total of 162 respondents participated in the study of mobile phone banking, while 142 featured in study of Internet banking. Results showed that both the adoption intent and perceptions of Internet banking amongst Internet users differ markedly from mobile phone banking amongst cell phone users, implying that success with one channel does not automatically translate into another channel, as the demographic profile and social context for each innovation differ.
Mattila, et al. [14] also studied the e-banking phenomenon, this time looking at mature bank customers. They collected via mail questionnaires to 3,000 Finland bank customers, divided into three segments (non-users, new users, old users) that differed in terms of Internet banking experience. Three questionnaires were partly tailored to these groups. Results show Internet banking as the third popular mode of payment among mature customers. Among mature customers, the main barriers of Internet banking adoption were Perceived difficulty in using computers combined with the lack of personal service in e-banking.
In addition, household income and education were found to have significant effect on the adoption of the Internet as a banking channel; for example, over 30 percent of wealthy and well-educated mature males make e-banking their primary mode of making bill payments. Our research did not focus on older bank customers; its focus was on college students in an Arab nation, for the results, we suspected, would be highly susceptible to social and demographic variabilities.
Interestingly, after all is said and done, our investigation more closely aligns with the Geetha and Malarvizhi [7] study, which measured the factors influencing undergraduate students' acceptance of Internet banking in Malaysia.
The theoretical framework for this work is informed by the Technology Acceptance Model (TAM). Initially proposed by Ndubisi and Jantan [15], TAM proponents assert that when users are presented with a new technology, how and when they use it is a function of a number of critical factors. More precisely, TAM is premised upon two beliefs, i.e., the perceived usefulness (PU) and the perceived ease of use (PEU). Perceived usefulness is the degree to which a user thinks a technology would enhance performance or productivity in the workplace. Perceived ease of use is the degree of lack of effort required by the user in adopting a given technology. Perceived ease of use also affects perceived usefulness.
Why was TAM selected? For starters, TAM is focused more on technology, and is adjudged different from previous models because it provides a valid measurement scale to predict user acceptance of IT. Second, TAM, more than any other model, is acclaimed for its parsimony and predictive power which make it easy to apply in different situations [16,17]. Third, relatively few studies have looked at how e-banking is fairing in an Arab nation, particularly the United Arab Emirates (UAE).
In the last two decades, new generation banks have sought ways to deliver better customer services and, in the process, how to add value to the customer banking experience. Since the focus of e-banking is to serve the customer well, the major factors relating to this objective deserve attention and investigation so as to help make informed decisions.
Like any other business, a bank’s ultimate goal is to gain, and sustain, competitive advantage. Fortuitously, a study in e-banking adoption is, as the saying goes, is just what the “doctor orders.” Results from such a study can help adjust and redirect the plans of the banking sector.
Research Problem
The ever-expanding customer base of banks, coupled with the interdependence and interconnectedness of the global economy, the operations management within bank lobbies created spurious dissatisfaction within the rank of average bank customers-thereby necessitating the introduction of e-banking. This fact is very telling, according to Gustke [18] who reported that12 million people used e-banking services in 2009. That number soared to 45 million by 2014. Thus, it is a natural sequence of events that banks would initiate measures to stem the tide, of even the slightest, of customer resistance, apathy, or attrition. Hence, most bank customers who appreciate easy, convenient, yet secure, access to their money, embrace the emergence of e banking.
Rationale and Statement of Hypotheses
The model (Figure 1) for this analysis consists of five latent variables, namely perceived ease of use (EOU), perceived usefulness (USFL), perceived web security (PWS), Attitude (ATTD), and intention to use (ITU). Each of the constructs, except the 5th, was measured by four observed variables scaled between 1 and 5; the last construct was measured by three observed variables.

Figure 1: Analysis of latent variables.
The model examined the effect or influence of EOU, USFL and PWS on the attitude (ATTD) of customers toward e-banking adoption. One part focused on the usefulness, while the other examined the impact of customer’s attitude on their intention to use/adopt e-banking.
In this study, four hypotheses were tested:
H1: The attitude of customers influences their intention to use e-banking.
H2: Perceived usefulness of e-banking has a positive/direct relationship with customer attitude toward e-banking.
H3: Perceived ease of use has a positive/direct relationship with customer’s attitude toward e-banking.
H4: Perceived web security has a positive/direct relationship with customer’s attitude toward e-banking.
Sample and Data Collection
We surveyed fifty-five respondents in a local university in Dubai, UAE. However, five respondents left a number of questions unanswered, and were consequently discarded, making the response rate 90.9%. We used a non-probability sampling technique, i.e., convenience sampling. The rationale for using convenience sampling rests on the notion that it is an easier, and cheaper, data collection approach, given that the study is exploratory. Using a self-administered questionnaire, the 50 respondents answered a number of dichotomous questions, on 5-point Likert scale and checklist questions.
Reliability of Constructs
We employed five constructs, namely perceived ease of use (EOU), perceived usefulness (USFL), perceived web security (PWS), Attitude (ATTD), and intention to use (ITU).
Using Cronbach’s Alpha (α) on SPSS for reliability analysis, all five constructs were reliable because they surpassed the recommended standard (Figure 6). It is one of the trusted and most accurate approaches for measuring reliability. Alpha (α) for EOU, USFL, PWS, ATTD, and ITU was 0.932, 0.907, 0.913, 0.907, and 0.913 respectively. Below are the tables from the outcome of reliability analysis for all constructs.
The profile of the respondents only covered Gender, Age and Level of education
Age of Respondents
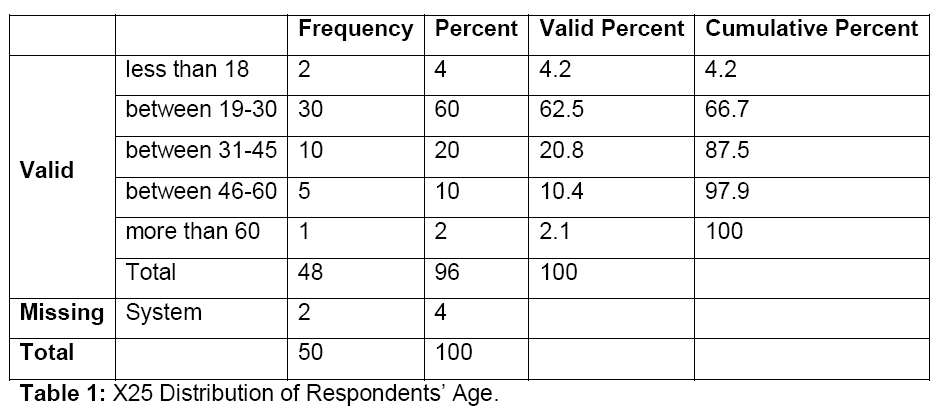
A majority (60%), sees Table 1, of the respondents was between 19-30 years old, and followed by 31-45 years, constituting 20%. Respondents over 60 years of age were only 2%. Some 4% ignored the age question, resulting in missing values.
Gender of Respondents
Table 2 presents the frequency analysis conducted on gender of the respondents; results show that 52% (majority) were male, and female 46%, while 2% declined to indicate their gender; so the data showed missing values.

Class Standing (Education) of the Respondents
Frequency analysis, in Table 3, below, shows that the majority (44%) of the respondents are bachelor ’s degree holders and 14% (the least) had a diploma. Some 24% were higher school certificate holders, and 18% with higher education, e.g., master’s.

In order to reduce the margin of error on data collection, appropriate screening and reliability analysis were done before any descriptive or inferential statistics were carried out. Below are the techniques used and the rationale for using them.
Descriptive Statistics: This is a way of describing the characteristic of data and also summary of the data sample collected for use. Descriptive statistics involves finding mode, mean, median, variance, standard deviation and frequency of a data set.
Frequency analysis: Frequency analysis was used to screen available data to make sure they were accurately entered, and also analyze variables by percentage. The outcome of frequency analysis showed data for this report was properly entered in SPSS.
PP-PLOT: We used this to ensure proper and normal distribution of variables. Outcome showed that all data points were close to the line, and all were normally distributed; so parametric statistic was employed.
Composite measure: To get the average of the variables in each construct, we used composite measure. All figures from average are within the designated scale (1 to 5).
Reliability analysis: To check reliability of the constructs and to ensure all variables measured the construct appropriately. This was done using the Cronbach Alpha coefficient (α), and all our variables are reliable. The reliability was validated in accordance with the social science research policy that says (α) should be greater or equal to 0.07 to be reliable. Cronbach Alpha, if item(s) were deleted, showed no significant improvement on any deleted variables for all constructs; therefore, none of the variables was deleted.
Inferential Statistics: Inferential statistics goes beyond mere summary or understanding of data; it helps researchers to make meaning and draw conclusion from data set. We did correlation, regression, analysis of variance, factor analysis, multiple comparisons, and cross tabulation.
Correlation analysis: It was used to measure the strength and degree of relationship/association between variables, basically, to show the effect one variable has on another. Correlation was done between variables of each of EOU, USFL, PWS, ATT, and ITU. Finally, correlation was done for all five constructs.
Regression analysis: It is used to measure how some variables impact or affect one another, usually involving dependent and independent variables. Simple regression measures the relationship between one dependent variable and one independent variable, while multiple regressions involve one dependent variable and more than one independent variables.
Analysis of variance (ANOVA), a powerful statistical tool, was used to measure any variation between variables, and the variables with the differences can be identified. There are two things we can do about the stated hypotheses above: 1) we either reject the null hypothesis (H1), or 2) we cannot reject the null hypothesis. If we reject the null hypothesis, it means there exists a difference in attitude among customers of different age groups, and if we do not reject the null hypothesis, it means no difference exists. For this report, ITU & ATTD are the dependent variables, while age and class standing are the independent variables for two different ANOVAs.
Multiple comparisons: It was used to measure the degree to which differences occurred among variables. We used this on certain variables, i.e., ATTD, ITTU and Class Standing. Findings show that no difference existed because all significant values were greater than 0.05.
Cross tabulation: It is used cross tabulation to generate the outcome of the combination of two variables. In this report, cross tab was done for only age and class standing.
Frequency Analysis: As explained earlier, in this report, we generated frequency analysis on all variables in every construct used. A few of the tables are shown and explained below.
Table 4 presents frequency distribution on the ease of use of e-banking; 40.8% of the respondents strongly agreed that e-banking is easy to use, while 26% agreed that overall, they find the use of Internet banking services easy.

Some 2% disagreed and 6% strongly disagreed to the statement. From the frequency analysis of all three remaining variables for EOU, the majority of the respondents either agreed or strongly agreed to the fact that they find e-banking easy to use. This implies that respondents confirm their satisfaction for ease of use of e-banking, and this has possibly encouraged them to keep using it.
On whether e-banking is useful item, see Table 5, the majority (48%) of the respondents strongly agreed that they find Internet banking useful, and 26% agreed to the statement also. Some 2% disagreed, and 4% strongly disagreed. From the frequency analysis of all three remaining variables for USFL, majority of the respondents either agreed or strongly agreed to the fact that they find e-banking useful. This implies that respondents confirm the e-banking is a good idea and it’s useful to them.

Table 6 shows the majority (32%) agreeing that Internet banking is a safe place to transmit sensitive information, while 12% strongly agreed and disagreed respectively. Some 16% strongly disagreed, and 2% declined to answer the question. To a reasonable extent, e-banking customers agreed that it is a safe platform to transact business, and, therefore, a good reason from them to adopt it. Notwithstanding, from the data gathered, there seems to be some level of lack of trust on the part of some users of e banking. From the frequency analysis of all three remaining variables for PWS, majority of the respondents were neutral about their concern for safety of e-banking.
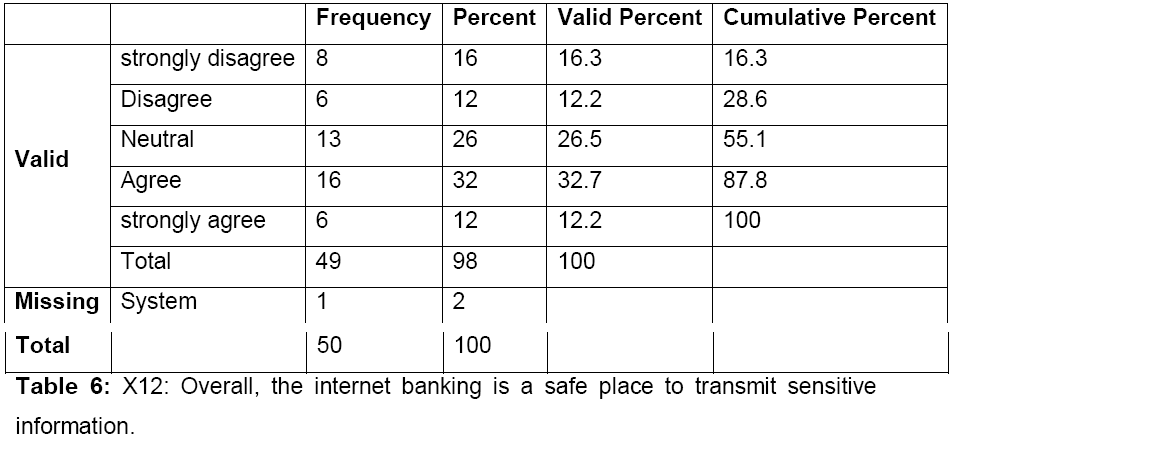
Table 7 shows that 42% (the majority) agreed that using the Internet banking is a good idea; some 32% strongly agreed; 4% strongly disagreed, 4% disagreed with the statement. From the frequency analysis of all three remaining variables for ATTD, a majority of the respondents have a positive attitude toward adopting e-banking and also confirmed that it is a good idea.

Table 8 shows that 36% (the majority) strongly agreed that they use Internet banking for banking needs, while 32% agreed; 4% strongly disagreed, and 8% disagreed. From the frequency analysis of all three remaining variables for ITU, majority either agreed or strongly agreed about their intention to use e-banking.

P-P PLOT
A number of graphs show normal distribution of the variables; none of the data points was far from the straight line. Only five significant ones are included in this report.

Figure 2: Analyzing “Overall, I find the use of the internet banking services easy”.
From the P-P Plot diagram in Figure 2, an analysis of “Overall, I find the use of the internet banking services easy” shows that the variable is normally distributed because data points are close and clustered around the line.
From the P-P Plot diagram in Figure 3, an analysis of “I would find the internet banking useful”, shows that the variable is normally distributed because data points are close and clustered around the line.

Figure 3: Analyzing “I would find the internet banking useful”.
The P-P Plot diagram, in Figure 4, an analysis of “the internet banking is a safe place to transmit sensitive information” shows the variable is normally distributed because data points are close and clustered around the line.

Figure 4: Analyzing “the internet banking is a safe place to transmit sensitive information”.
From the P-P Plot diagram in Figure 5, an analysis of “Using the internet banking is a good idea” shows that the variable is normally distributed because data points are close and clustered around the line.

Figure 5: Analyzing “Using the internet banking is a good idea”.
The P-P Plot diagram, in Figure 6 above, an analysis of “I would use the internet banking for my banking needs,” shows that the variable is normally distributed because data points are close and clustered around the line.

Figure 6: Analyzing “I would use the internet banking for my banking needs”.
We used composite measure to find average of variables by using five scales for the survey. The scales used were 1, 2, 3, 4, and 5; the essence of this was to be sure that our constructs are latent variables that cannot be measured directly but with the help of other variables. The outcome of the composite of each construct generated another table on the data of our SPSS, and the values were between 1 and 5. For the record,
5 represents strongly agree
4 represents agree
3 represents neural
2 represents disagreed
1 represents strongly disagreed

Figure 7: Composite measures.
All the variables show good reliability. Cronbach’s alpha was greater than 0.9 in all constructs.
Table 9 shows the value of Alpha at 0.907, which is greater than 0.70; therefore, the variables (x1, x2, x3, x4) are reliable and measured ease of use accurately.
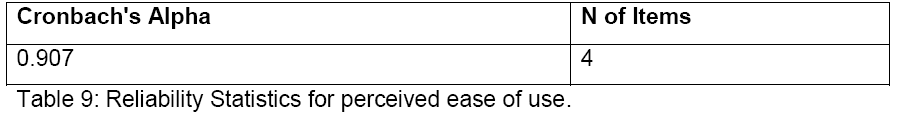
Table 10 shows the value of Alpha at 0.932, which is greater than 0.70; therefore, the variables (x5, x6, x7, x8) are reliable and measured perceived usefulness of e-banking accurately.

Table 11 shows the value of Alpha is 0.913, which is greater than 0.70; therefore, the variables (x9, x10, x11, x12) are reliable and measured perceived web security accurately.
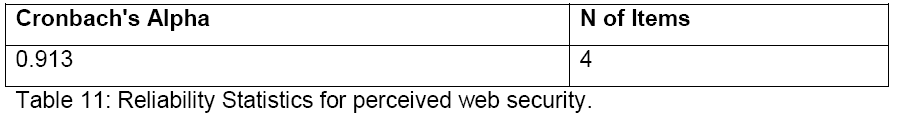
Table 12 shows the value of Alpha is 0.907, which is greater than 0.70; therefore, the variables (x13, x14, x15, x16) are reliable and measured customer’s attitude accurately.
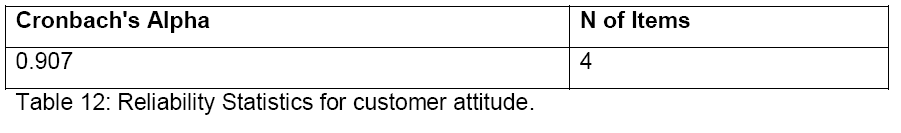
Table 13 shows the value of Alpha is 0.913, which is greater than 0.70; therefore, the variables (x17, x18, x19) are reliable and measured customer’s intention to use e-banking accurately.

Correlation for all five constructs:

Table 14, above, shows the coefficient of correlation r for EOU and USFL is 1.000, meaning there is perfect correlation between ease of use and perceived usefulness of e-banking. As ease of use of e-banking increases, by any unit, usefulness also increases by the same unit and vice versa, a parallel relationship. The P-value is 0.000 (less than 0.05); the relationship is significant.
The value of r for EOU and PWS is 0.306, meaning there is a weak correlation between ease of use and perceived web security. The P-value is 0.032 (less than 0.05), meaning the relationship is significant.
The value of r for EOU and ATTD is 0.743, indicating a moderate correlation between ease of use and customers attitude toward e-banking. The P-value is 0.000 (less than 0.05), meaning the relationship is significant.
The value of r for EOU and ITTU is 0.820, indicating a strong correlation between ease of use and customers’ intention to use e-banking. The P-value is 0.000 (less than 0.05), meaning the relationship is significant.
The value of r for USFL and PWS is 0.306, meaning there is a weak correlation between usefulness and perceived web security. The P-value is 0.032 (less than 0.05), meaning the relationship is significant.
The value of r for USFL and ATTD is 0.743, meaning there is a moderate correlation between usefulness and customer’s attitude towards e-banking. The P-value is 0.000 (less than 0.05), meaning the relationship is significant.
The value of r for USFL and ITTU is 0.820, it shows there is strong correlation between usefulness and customer intention to use e-banking. The P-value is 0.000 (less than 0.05); meaning the relationship is significant.
The value of r for PWS and ATTD is 0.495; it shows there is a weak correlation between perceived web security and customer’s attitude toward e-banking. The P-value is 0.000 (less than 0.05), meaning the relationship is significant.
The value of r for PWS and ITTU is 0.382, indicating a weak correlation between perceived web security and customer intention to use e-banking. The P-value is 0.007(less than 0.05), meaning the relationship is significant.
The value of r for ATTD and ITTU is 0.779, which means there is strong correlation between attitude of customers and intention to use e-banking. The P-value is 0.000 (less than 0.05), meaning the relationship is significant.

Table 15, above, shows the coefficient of correlation r is 0.740, showing a moderate correlation between x1 and x2. The P-value is 0.000 (less than 0.05), making the relationship significant.
• The value of r is 0.752, showing strong correlation between x1 and x3. The P-value is 0.000 (less than 0.05), meaning the relationship is significant.
• The value of r is 0.713, showing there is moderate correlation between x1 and x4. The P-value is 0.000 (less than 0.05); making the relationship significant.
• The value of r is 0.710, showing there is moderate correlation between x2 and x3. The P-value is 0.000 (less than 0.05); the relationship is significant.
• The value of r is 0.764, meaning there is strong correlation between x2 and x4. The P-value is 0.000 (less than 0.05); the relationship is significant.
• The value of r is 0.818; it shows there strong correlation between x3 and x4.
The P-value is 0.000 (less than 0.05); the relationship is significant.
Table 16 shows that the coefficient of correlation r is 0.834, meaning there is a strong correlation between x5 and x6. The P-value is 0.000 (less than 0.05), making the relationship significant.

• The value of r is 0.596, which means there is moderate correlation between x5 and x7. The P-value is 0.000 (less than 0.05); the relationship is significant.
• The value of r is 0.572, which means there is moderate correlation between x5 and x8. The P-value is 0.000 (less than 0.05); the relationship is significant.
• The value of r is 0.808; it shows there is strong correlation between x6 and x7. The P-value is 0.000 (less than 0.05), making the relationship significant.
• The value of r is 0.695; it shows there is moderate correlation between x6 and x8. The P-value is 0.000 (less than 0.05), making the relationship significant.
• The value of r is 0.732; it shows there is moderate correlation between x7 and x8. The P-value is 0.000 (less than 0.05), meaning the relationship is significant.
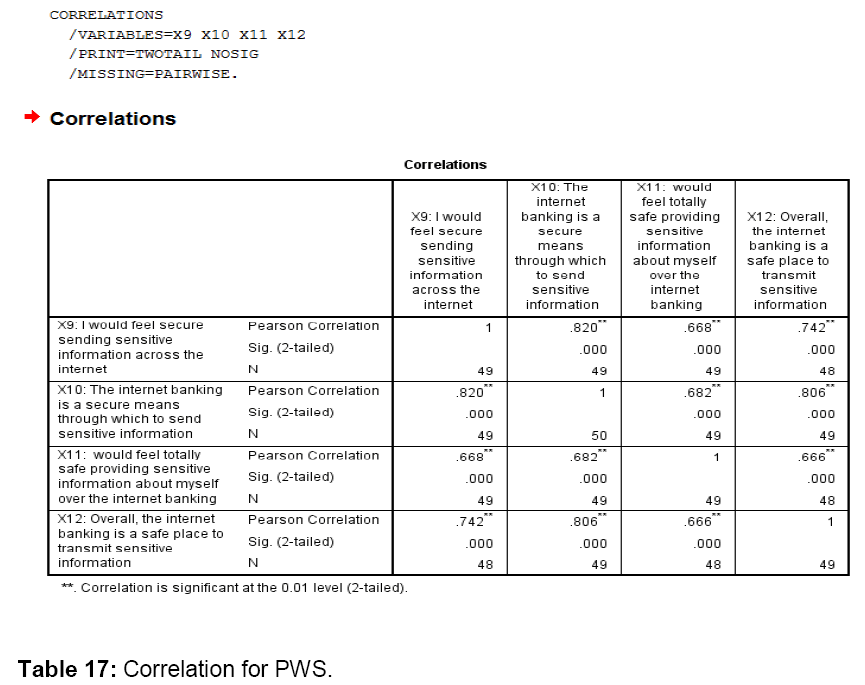
Analysis from Table 17 above:
• The coefficient of correlation r is 0.820, in Table 17, showing a strong correlation between x9 and x10. The P-value is 0.000 (less than 0.05); the relationship is significant.
• The value of r is 0.668, meaning there is moderate correlation between x9 and x11. The P-value is 0.000 (less than 0.05); the relationship is significant.
• The value of r is 0.742, which shows there is moderate correlation between x9 and x12. The P-value is 0.000 (less than 0.05); the relationship is significant.
• The value of r is 0.682, meaning there is moderate correlation between x10 and x11. The P-value is 0.000 (less than 0.05), making the relationship significant.
• The value of r is 0.806, which means there is strong correlation between x10 and x12. The P-value is 0.000 (less than 0.05); the relationship is significant.
• The value of r is 0.666, meaning there is moderate correlation between x11 and x12. The P-value is 0.000 (less than 0.05), making the relationship significant.
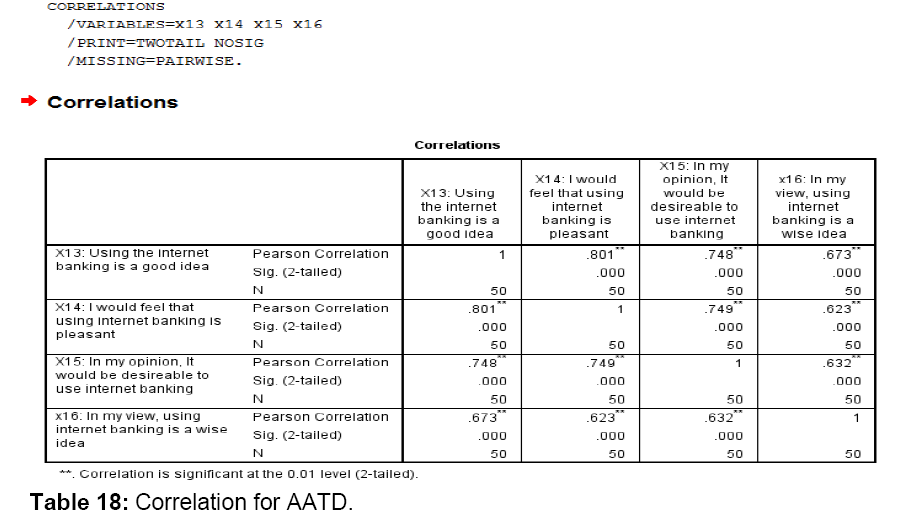
Analyzing from the Table 18 above:
• The coefficient of correlation r is 0.808; it shows there is strong correlation between x13 and x14. The P-value is 0.000 (less than 0.05); the relationship is significant.
• The value of r is 0.748; it shows there is moderate correlation between x13 and x15. The P-value is 0.000 (less than 0.05), making the relationship significant.
• The value of r is 0.673; it shows there is moderate correlation between x13 and x16. The P-value is 0.000 (less than 0.05), meaning the relationship is significant.
• The value of r is 0.749; it shows there is moderate correlation between x14 and x15. The P-value is 0.000 (less than 0.05), making the relationship significant.
• The value of r is 0.623; it shows there is moderate correlation between x14 and x16. The P-value is 0.000 (less than 0.05), meaning the relationship is significant.
• The value of r is 0.632; it shows there is moderate correlation between x15 and x16. The P-value is 0.000 (less than 0.05); the relationship is significant.
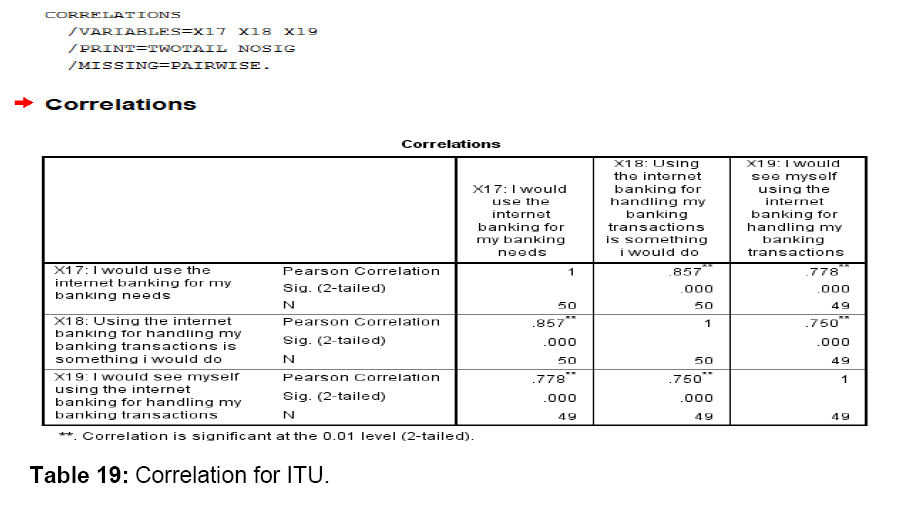
Analysis from Table 19 above:
• The coefficient of correlation r is 0.857; it shows there is strong correlation between x17 and x18. The P-value is 0.000 (less than 0.05), meaning the relationship is significant.
• The value of r is 0.778; it shows there is strong correlation between x17 and x19. The P-value is 0.000 (less than 0.05); the relationship is significant.
• The value of r is 0.750; it shows there is moderate correlation between x18 and x19. The P-value is 0.000 (less than 0.05); the relationship is significant.
A multiple regression analysis was conducted on customer attitude, ease of use, usefulness, and perceived web security. ATTD as the dependent variable, and EOU, USFL, PWS as independent variables.
H0: Perceived usefulness of e-banking has a positive/direct relationship with customer attitude toward e-banking
H0: Perceived ease-of-use has a positive/direct relationship with customer’s attitude toward e-banking
H0: Perceived web security has a positive/direct relationship with customer’s attitude toward e-banking.
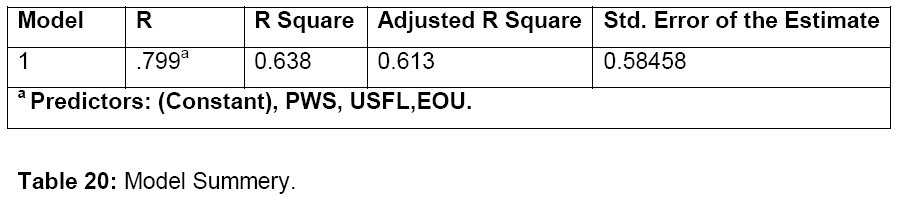
Table 20, above, shows the coefficient of correlation R is 0.799, indicating a strong relationship between the dependent (attitude) and independent variables (EOU, USFL, and PWS). The coefficient of distribution R square is 0.638. This shows that 63.8% variation in customer attitude is explained by EOU, USFL, and PWS.
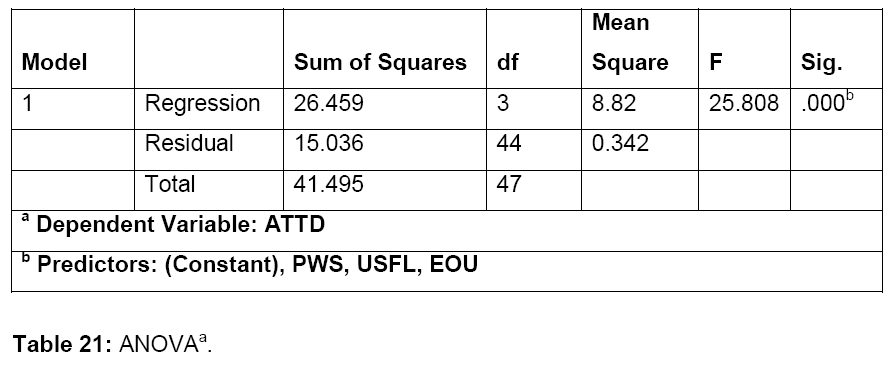
As shown in ANOVA Table 21 above, the P-value is 0.000, which is less than 0.05; therefore, the relationship is significant.
The coefficient Table 22 shows how much every single variable contribute to the model we used in this research. Below are the equations derived from the coefficient Table 22:

Y1=β0 + β1X1 + β2X2 + β3X3------------------------------equation 1
Y1=0.450 + 0.197X1 + 0.458X2 + 0.246X3---------------equation 2
x1 Represents EOU
x2 Represents is USFL
x3 Represents PWS
Y1 Represents ATTD
From equation (2) above, perceived usefulness contributes more (45.8%) to customer attitude toward adoption of e-banking than other others construct. Perceived web security contributes 24.6% to customer’s attitude toward adoption of e-banking. Lastly, ease of use contributes the least (19.7%) towards customer’s attitude.
A simple regression analysis was conducted on attitude and intention to use, ITTU, as the dependent variable and ATTD as the independent variable.
Hypothesis
H0: The attitude of customers influences their intention to use e-banking.
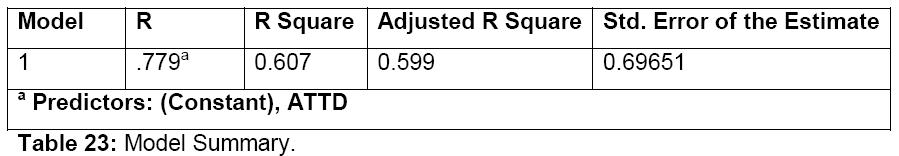
Table 23 shows that the coefficient of correlation R is 0.799, meaning there is a strong relationship between the dependent variable (ITU) and independent variable (ATTD).
The coefficient of distribution R square is 0.607. This shows that 60.7% variation in customer’s intention to use e-banking is explained by customer’s attitude

From Table 24, above, the P-value is 0.000, which is greater than 0.05; therefore, the relationship is significant. Please note: P=0.000 means P<0.0005. if P>=0.0005, p=0.0001.

Below are the equations derived from the coefficient in Table 25:
Y2=β0 + β1x1 -------------------------------------equation 3
Y2=0.361 + 0.903x1------------------------------equation 4
x1 represents attitude
Y2 represents intention to use
From the equation (4) above, attitude contributed 90.3% to customer’s intention to use e-banking.
Table 26 shows no difference exists in customer’s attitude and customer’s intention to use e-banking between different classes standing because all sig. values are more than 0.05.

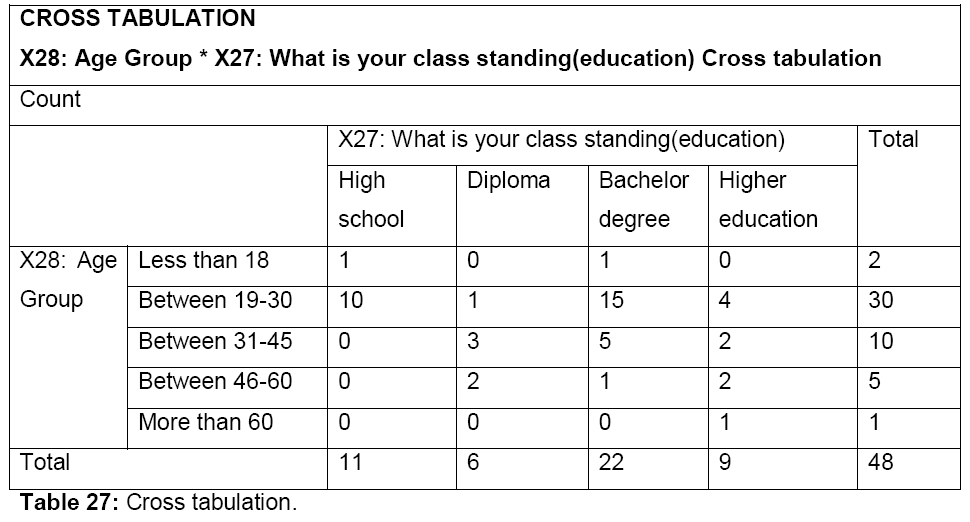
Table 27 shows the majorities (30%) of the respondents are between the age of 19 and 30. 10 are high school certificate holders; 1 has diploma; 15 are bachelor’s degree holders, and 4 had higher education.
• Results of the analysis show that majority of the respondents were male. In addition, majorities were between the age of 19 and 30 years old and majorities are bachelor’s degree holders.
• Bank customers in Dubai find e-banking easy and useful for them. This fact is drawn from the frequency tables because most respondents went for either agreed or strongly agreed for all the questions relating to EOU and USFL.
• Respondents reported that e-banking is safe to a reasonable extent.
• Subsequent analysis of findings shows that attitude of customers plays a major role in their intention to use e-banking in Dubai.
• Ease of use, usefulness and perceived web security influence customer attitude toward e-banking. Usefulness has greater influence on customer’s attitude, but web security has the least effect.
• The intention of customers to use e-banking is influenced by ease of use and perceived usefulness. Perceived web security has minimal influence on a customer’s attitude and intention to use e-banking; therefore, customers believe e-banking is secured.
• Finally, there is perfect correlation between ease of use and perceived usefulness. This implies that the easier customers find the platforms of e-banking, the more useful it will be for them, and the more they will be willing to adopt it.
From the single and multiple regression analysis on SPSS, usefulness is very important in changing the attitude of customers toward adoption of e-banking. This implies that the usefulness of e-banking matters to the customers.
The primary limitation is that the sampling technique not random, i.e., not a probability sampling, and the results cannot be generalized.
The key secondary limitation is that sample size is not enough to yield robust empirical findings, and, therefore, results cannot be generalized.
The variable Cost of e-banking transaction, i.e., in time and money, was not included in this analysis; maybe this could have made a difference on the outcome.
From the single and multiple regression analysis on SPSS, usefulness is very important in changing the attitude of customers toward adoption of e-banking. This implies that the usefulness of e-banking matters to the customers.
When measuring the intention of customer to use e-banking, close attention should be paid of customer’s attitude. Future research can focus on expanding the size of the sample, and including other six emirates, Abu Dhabi, Ajman, Sharjah, Fujairah, Ras Al Khaimah, Umm Al Quwain, in the UAE. Many other factors influence attitude and intention of customers to use e-banking; further research could incorporate more of these factors in order to have more meaningful and elaborate outcome.
Technology has changed the role the banking industry plays. Since the objective of e-banking is to serve the customers appropriately, banks should ensure that all their e-banking channels are easy to use (user friendly) and safe from any form of loss due to fraudulent activities. Banks can also improve/develop more useful functionality on e-banking platforms, for customer perception of usefulness changes their attitude toward it, while attitude, in turn, influences intention to use e-banking. In short, both customer perception of, and intention to use, e-banking are a function of attitude (ATTD) toward e-banking.
In this study, we examined whether: 1) the attitude of customers influences their intention to use e-banking. 2) Perceived usefulness of e-banking has a positive/direct relationship with customer attitude toward e-banking; 3) Perceived ease-of-use has a positive/direct relationship with customer’s attitude toward e-banking; 4) Perceived web security has a positive/direct relationship with a customer’s attitude toward e-banking. In all cases, the response was affirmative. In essence, bank customers, worldwide; now have, at their disposal, the option of either using, for their banking needs, brick-and-mortar, or e-banking, at their convenience. Customers in Dubai are no exceptions, as they, too, have experienced a slew of changes in the banking sector. To reiterate, e-banking has expanded access to financial services by increasing accessibility and lowering the cost of offering formal financial services. Thus, the trend is growing on bank customers, changing attitude in the process. Going forward, it obvious that retail bank customers remains the key drivers, indeed, the raison d'etre, for the banking industry.
Copyright © 2025 Research and Reviews, All Rights Reserved